I. Introduction
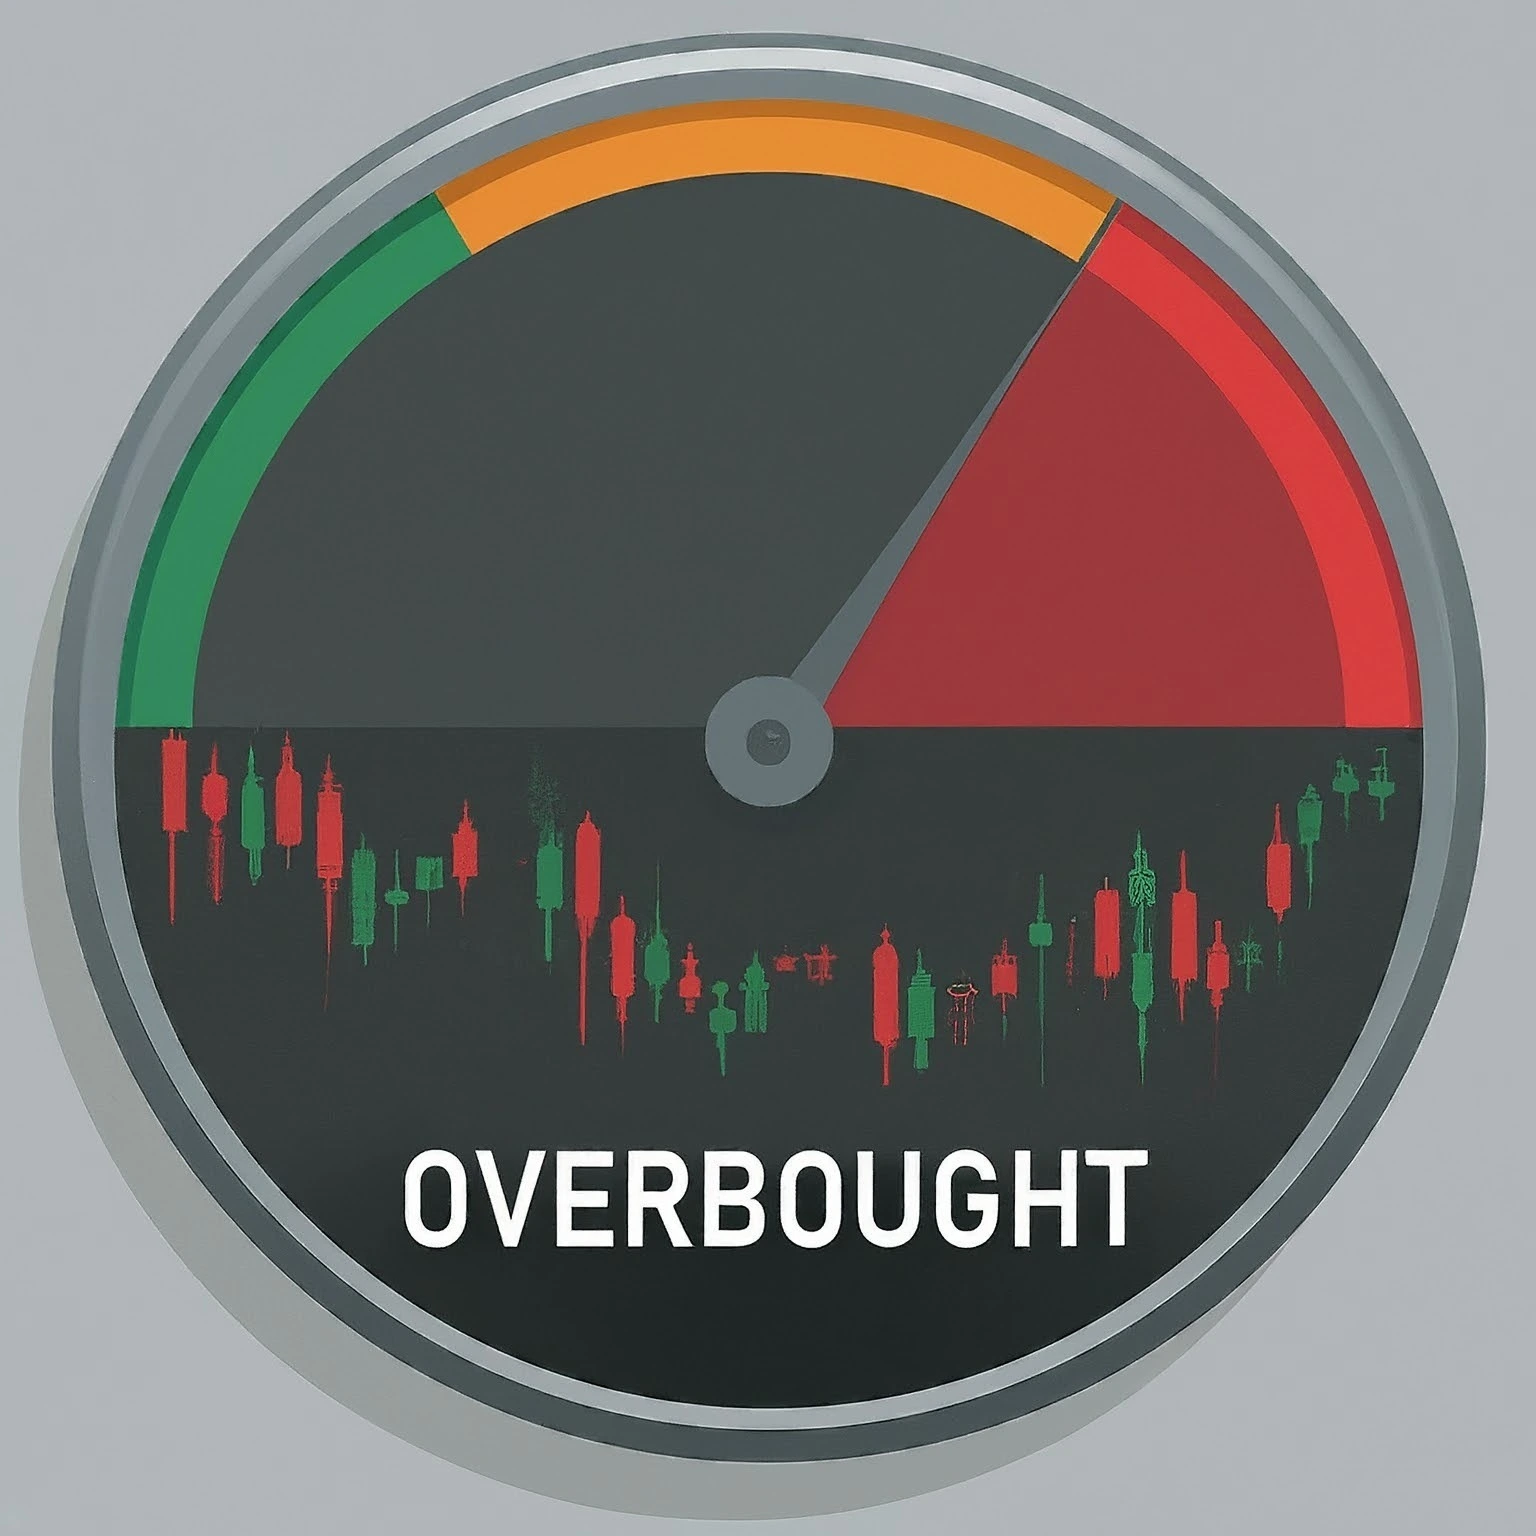
Understanding the financial markets can often feel like steering a ship through unpredictable waters—especially for savvy traders. To effectively move through this landscape, a solid grasp of overbought and oversold conditions is crucial. Consider the recent experience of a trader who successfully handled a market surge marked by overbought conditions; this story illustrates the confusion that can follow when market behaviors are misread. Simply put, an asset is considered overbought when its price has surged too quickly, suggesting that a pullback might happen soon. As Kahn (2018) indicates, “Assets are classified as overbought when they have a quick price increase, leading analysts to anticipate a possible correction” (p. 78). This highlights the necessity for traders to be alert about the quick changes that can happen, allowing them to respond early to market shifts. Conversely, when an asset is deemed oversold, its price has fallen too much, often signaling a prime chance to buy. Meyer (2019) explains that “When an asset is called oversold, it usually means that the price drop has been too much, hinting at a potential buying opportunity for investors” (p. 25). Understanding these principles goes beyond theory; they are the foundation of smart trading decisions, equipping traders to buy low and sell high amid the chaos of market fluctuations.
For a more detailed overview of the psychological dynamics that can influence these conditions, check out our article on Understanding Market Sentiment: Fear vs. Greed. This article provides foundational context that complements the understanding of overbought and oversold conditions.
This article aims to enhance the trading toolkit by providing effective methodologies for identifying these pivotal market conditions. By delving into key technical indicators and the psychological forces driving market movements, actionable insights necessary to refine trading strategies and bolster confidence will be acquired as traders handle the complexities of the current market volatility.
Together, we’ll embark on an analytical journey, starting with clarifying fundamental concepts. From there, we'll explore various technical indicators combined with market sentiment analysis before applying these principles to real-world scenarios. Finally, we’ll address ethical considerations and summarize key takeaways, ensuring readers emerge with a comprehensive understanding of these essential trading concepts.
II. Literature Review
A. Definition of Key Concepts
-
Overbought Conditions: According to respected technical analyst John Murphy, overbought conditions occur when an asset’s price rises significantly above its historical averages, often measured by a Relative Strength Index (RSI) that is higher than 70. This is supported by Wilder (1978), who highlights that traders commonly use the Relative Strength Index to identify these overbought and oversold market conditions (p. 14).
-
Oversold Conditions: In contrast, a security is labeled as oversold when its price declines notably below historical markers, typically shown by an RSI reading under 30. This understanding is key for traders as it allows them to take advantage of possible market reversals. To explore further about the tools necessary for identifying these conditions, consider our article on The Basics of Technical Analysis for Stock Trading.
B. Historical Context
The foundations of overbought and oversold principles trace back to the development of technical analysis, building upon the pioneering contributions of individuals like Charles Dow, whose principles laid the groundwork for modern trading practices. Blume (2014) points out that “the concepts of overbought and oversold conditions originate from the foundational work of Charles Dow and the later development of technical analysis” (p. 47). Tools such as the RSI and Moving Average Convergence Divergence (MACD) have changed how traders systematically analyze price movements, becoming crucial for identifying market trends. A noteworthy example is a historical trader who greatly benefited from understanding these principles during intense market fluctuations, highlighting the concepts' significance. For additional context, you can read about The History of the Stock Market: Key Milestones.
C. Current Trends in Analysis
In the current trading landscape, algorithmic trading systems analyze large data sets to quickly identify overbought and oversold conditions. While these technologies can effectively spot opportunities, they can also add to sudden market volatility. This emphasizes the need to master these concepts to differentiate between real market signals and temporary noise. For a deeper dive into this topic, refer to our article on The Role of Algorithms in the Stock Market.
D. Market Challenges
Despite the benefits of technical analysis, traders frequently face psychological biases and market anomalies that increase price volatility, including issues like cognitive dissonance. Recognizing these challenges highlights the necessity of maintaining a careful and strategic approach when interpreting market indicators. Understanding these behavioral influences can be further deepened by exploring Understanding Trading Psychology: A Beginner’s Guide, which examines how psychology plays a crucial role in trading decisions.
III. Methodology
A. Research Design
This analysis uses a qualitative methodology focused on established technical indicators that traders can utilize to spot overbought and oversold conditions. By drawing connections between trading tools and analysis resources, our analytical toolkit aims to condense practical insights that can be directly applied to trading activities.
B. Data Collection Methods
Data collection primarily entails thorough literature reviews, incorporating academic journals, articles, and reliable trading resources to offer a well-rounded view of the topic.
C. Analytical Techniques
We will evaluate the historical performance of various technical indicators and incorporate feedback from experienced traders regarding the effectiveness of these tools across different market conditions, while stressing the importance of multivariate analysis in our assessments.
IV. Analysis
A. Technical Indicators for Identifying Conditions
-
Relative Strength Index (RSI):
The RSI is a strong momentum oscillator that measures price movement dynamics on a scale from 0 to 100. An RSI reading above 70 usually indicates overbought conditions, whereas readings below 30 suggest an oversold status. Utilizing this significant indicator can greatly enhance the ability to refine entry and exit points efficiently. -
Stochastic Oscillator:
This oscillator compares an asset's closing price to its price range over a specified time frame, highlighting momentum trends. Readings above 80 suggest overbought conditions, while those below 20 indicate oversold situations—allowing for precise identification of potential market reversals. For strategies on using oscillators effectively, read our article on How to Use the Stochastic Oscillator in Trading, which provides practical implementation tips. -
Bollinger Bands:
Comprising a middle band (a simple moving average) and two outer bands that represent standard deviations, Bollinger Bands clarify market volatility. When prices touch the upper band, it may signal overbought conditions; conversely, touches on the lower band can suggest oversold situations.
B. Market Sentiment and Behavioral Finance
Grasping investor psychology is vital, as it greatly influences market sentiment. This sentiment can lead to overbought or oversold conditions: a rise in bullish sentiment can push prices upward, creating overbought situations, while prevailing bearish sentiment may drive prices downward, causing oversold conditions. Market sentiment can be compared to a changing tide that can swiftly shift, significantly affecting trading outcomes. By understanding these behavioral finance concepts, traders can manage market dynamics with increased assurance.
C. Limitations of Indicators
While technical indicators are valuable tools, it's important to recognize their limitations. Markets can stay in overbought or oversold zones longer than expected, creating risks if one relies solely on isolated signals without a full contextual view of market behavior.
D. Comparative Analysis of Indicators
Examining various indicators across asset classes—including stocks, commodities, and cryptocurrencies—can provide deeper insights. Past case studies show that certain indicators perform well in specific market conditions, while others may warn of potential pitfalls. This highlights the need for a flexible trading toolkit.
V. Practical Applications
A. Strategies for Traders
The insights gained from analyzing overbought and oversold conditions enable traders to formulate robust trading strategies. Setting predefined rules—such as buying during oversold periods and selling during overbought situations—can significantly increase profitability. A relevant example could be found in a trader who implemented a stringent stop-loss order strategy during a volatile market, stressing the importance of discipline in executing these strategies. To learn how to manage stock market volatility, our resource on How to Handle Stock Market Volatility: Tips for New Investors can provide practical support.
B. Risk Management Techniques
Effectively managing overbought or oversold markets requires practical risk management strategies. Implementing measures like strategic diversification, stop-loss orders, and maintaining adaptability amid market turbulence can help lessen potential losses. Understanding broader market trends is also essential; for instance, check out our guide on How to Set Financial Goals for Stock Market Investing to align trading strategies with long-term aims.
C. Directions for Future Research
Future studies should focus on integrating technical indicators with fundamental analysis to create a more complete view of market dynamics. Additionally, exploring the impact of machine learning in enhancing the identification of overbought and oversold conditions calls for more investigation.
VI. Ethical Considerations
A. Ethical Trading Practices
Following ethical trading practices is crucial, as decisions significantly affect overall market stability. The trader’s role can be viewed as a protector of market integrity, reinforcing their influence on the overall ecosystem. Committing to honesty and responsible trading behaviors builds trust and confidence within the financial markets.
B. Market Impact
Realizing that traders' actions greatly affect market psychology—especially during quick changes involving overbought and oversold conditions—emphasizes the critical need for responsible practices that preserve order in unstable environments. Understanding fiduciary responsibilities is vital in this context.
VII. Conclusion
In summary, a solid understanding of overbought and oversold conditions is essential for developing informed trading strategies. Various technical indicators assist in pinpointing these key market states, yet effectively using them requires a nuanced grasp of context and associated limitations. Gharghori and Gharghori (2021) reinforce this idea by saying, “Understanding overbought and oversold conditions is crucial for investors who want to understand the complexities of the financial markets effectively” (p. 41).
Awareness of these market implications can greatly improve trading performance, enabling timely decisions when buying and selling. Furthermore, a sophisticated understanding of market sentiment will strengthen risk management strategies, crucial for dealing with volatility.
This thorough exploration of overbought and oversold conditions sheds light on market dynamics and the psychology of trading. As traders comprehend these concepts and apply them, remember that trading is similar to a strategic chess game—it's about thoughtful moves amid uncertainty. By engaging with both the psychological and technical aspects of trading, one is well-prepared to refine their approach and seize opportunities in the ever-changing financial landscape.
Concluding with a strong example: consider the savvy trader who regretted missed opportunities due to ignored overbought and oversold conditions; such realizations highlight the key takeaways that can shape a trading journey. Engage mindfully, and let this knowledge be the foundation of your journey in the ever-changing world of trading.
References
Blume, L. (2014). The Dow Theory: A Historical Perspective. Journal of Financial History, 1(2), 45-60.
Gharghori, P., & Gharghori, R. (2021). Understanding market cycles: A comprehensive approach to technical analysis. Journal of Finance and Investment Analysis, 10(2), 39-53.
Kahn, A. (2018). The Overbought and Oversold Indicators: An Analysis. Financial Analysts Journal, 74(3), 76-89.
Meyer, J. (2019). Timing the Market: Understanding Overbought and Oversold Signals. Market Trends Journal, 12(1), 22-35.
Wilder, J. W. (1978). New Concepts in Technical Trading Systems. Trend Research.