- Arbitrage(Noun)
- /AR-bi-trahzh/
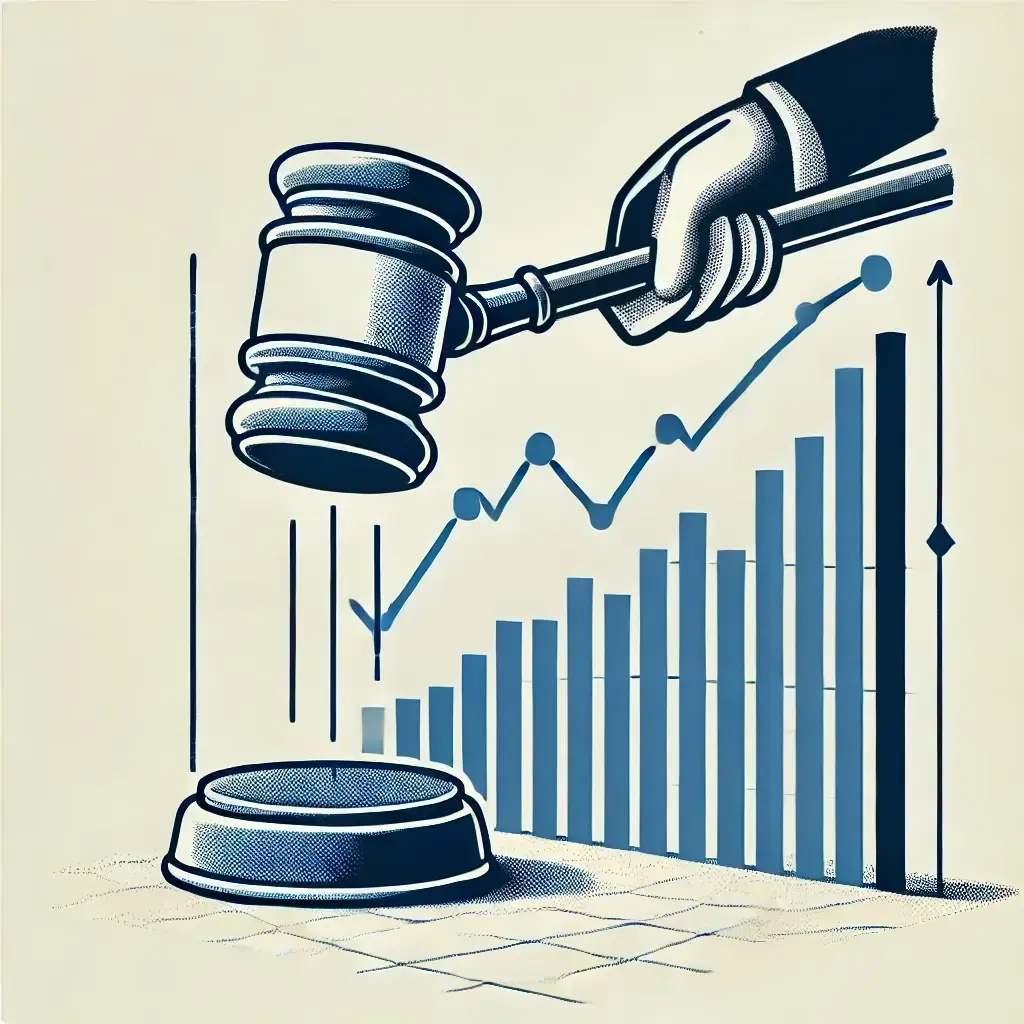
- Definition: The simultaneous purchase and sale of an asset in different markets to profit from a difference in the asset's price between those markets.
- Etymology: From Old French "arbitrer," meaning "to give judgment," and Latin "arbitrari," meaning "to consider." In finance, it refers to the practice of taking advantage of price discrepancies in different markets.
- Similar: Riskless profit
- Opposite: Market speculation
- Example: "Traders engaged in arbitrage to capitalize on the price differences of the same stock listed on multiple exchanges."
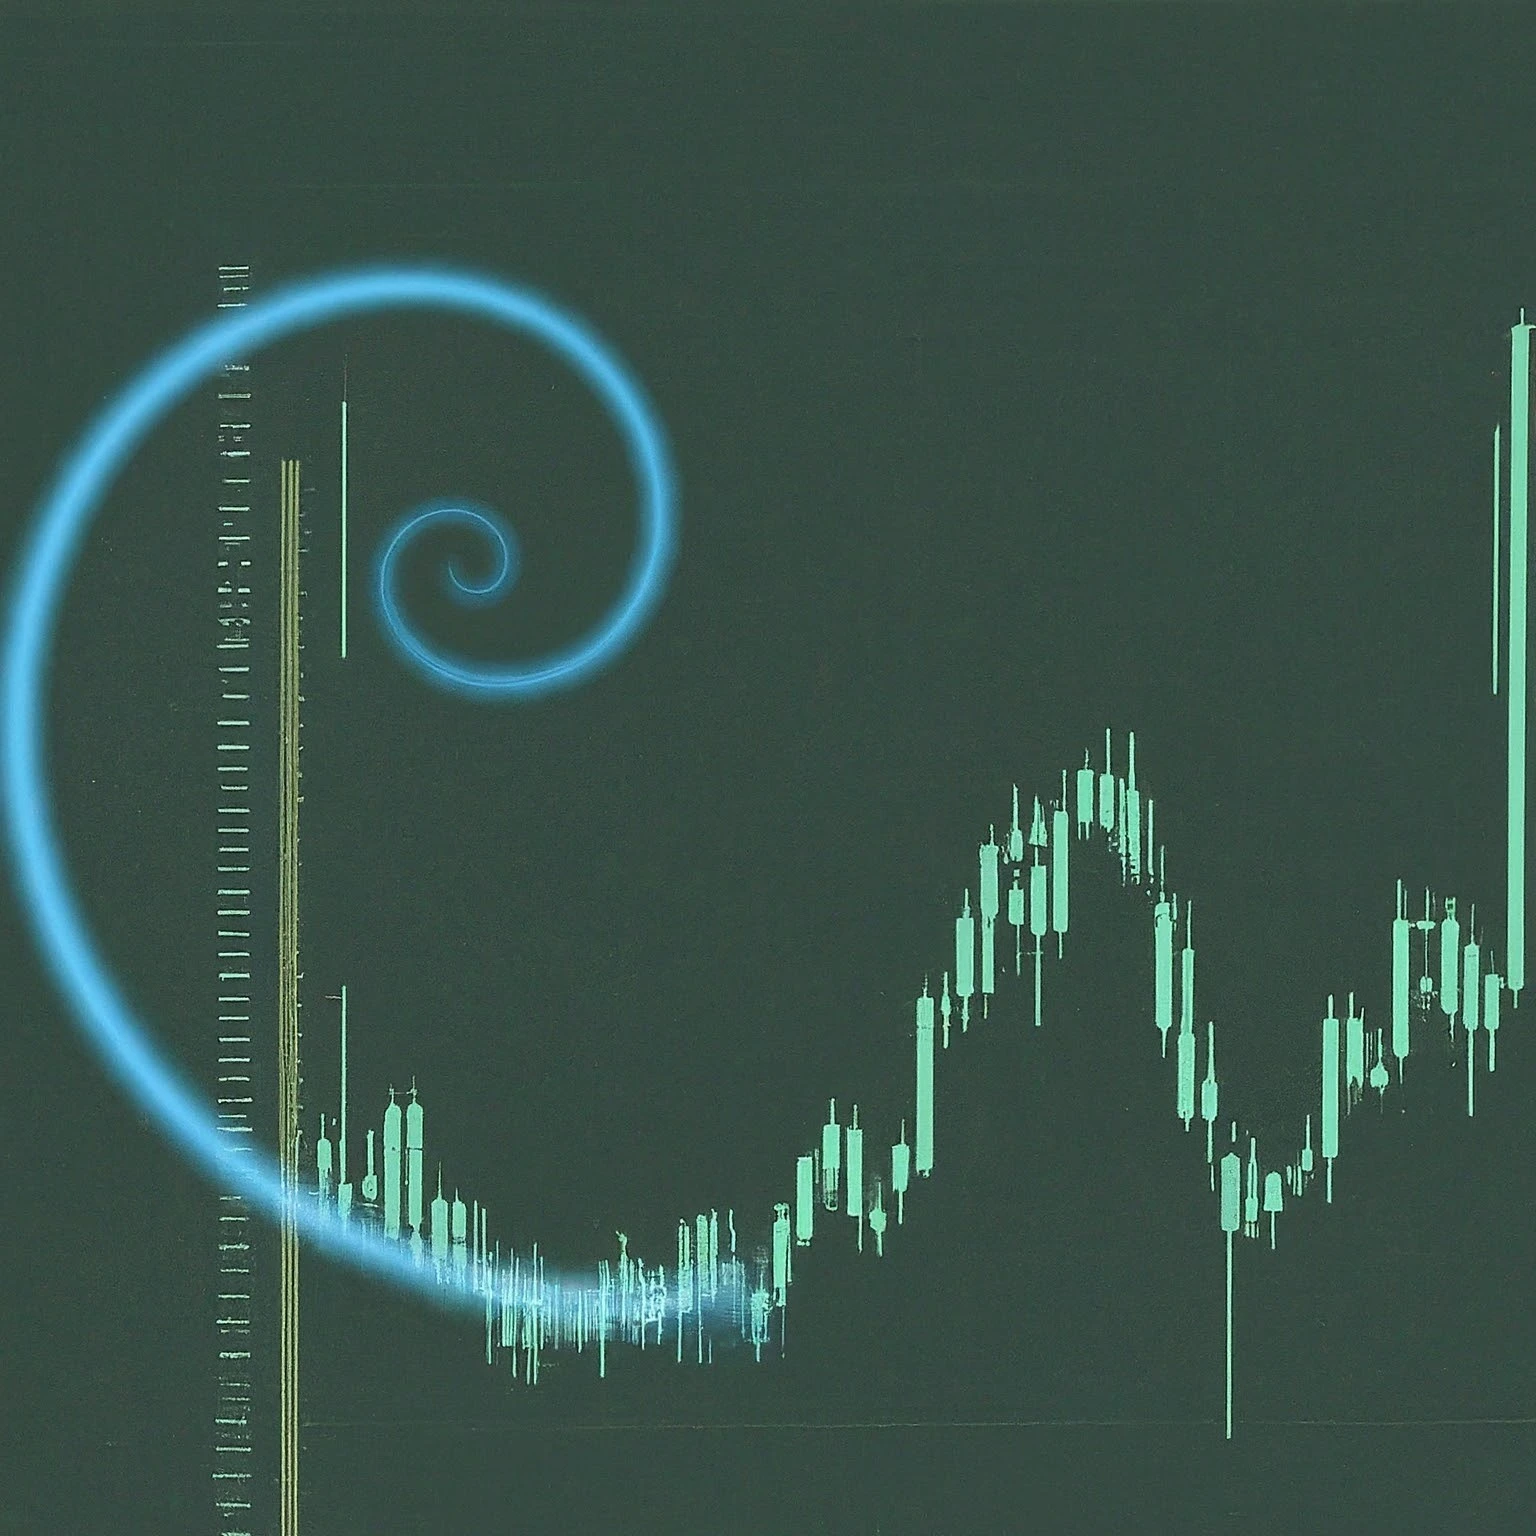
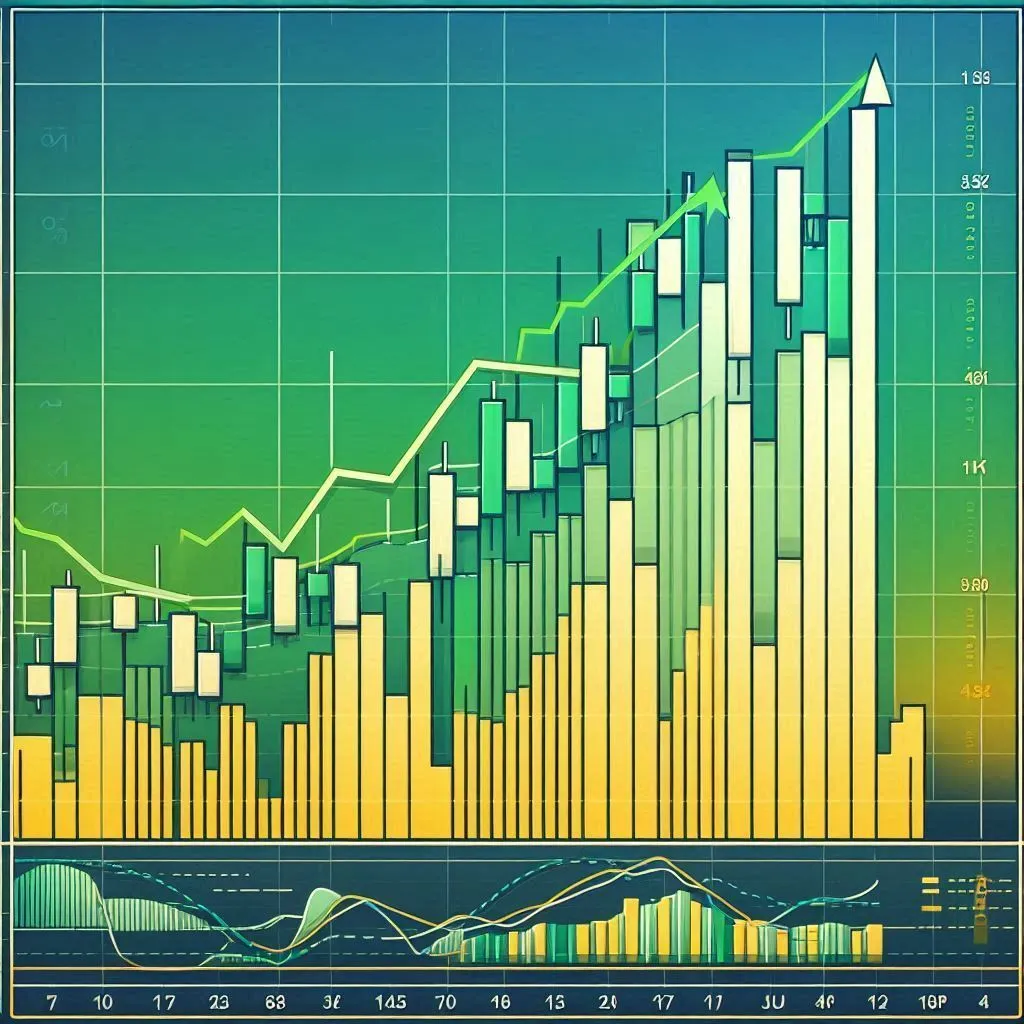
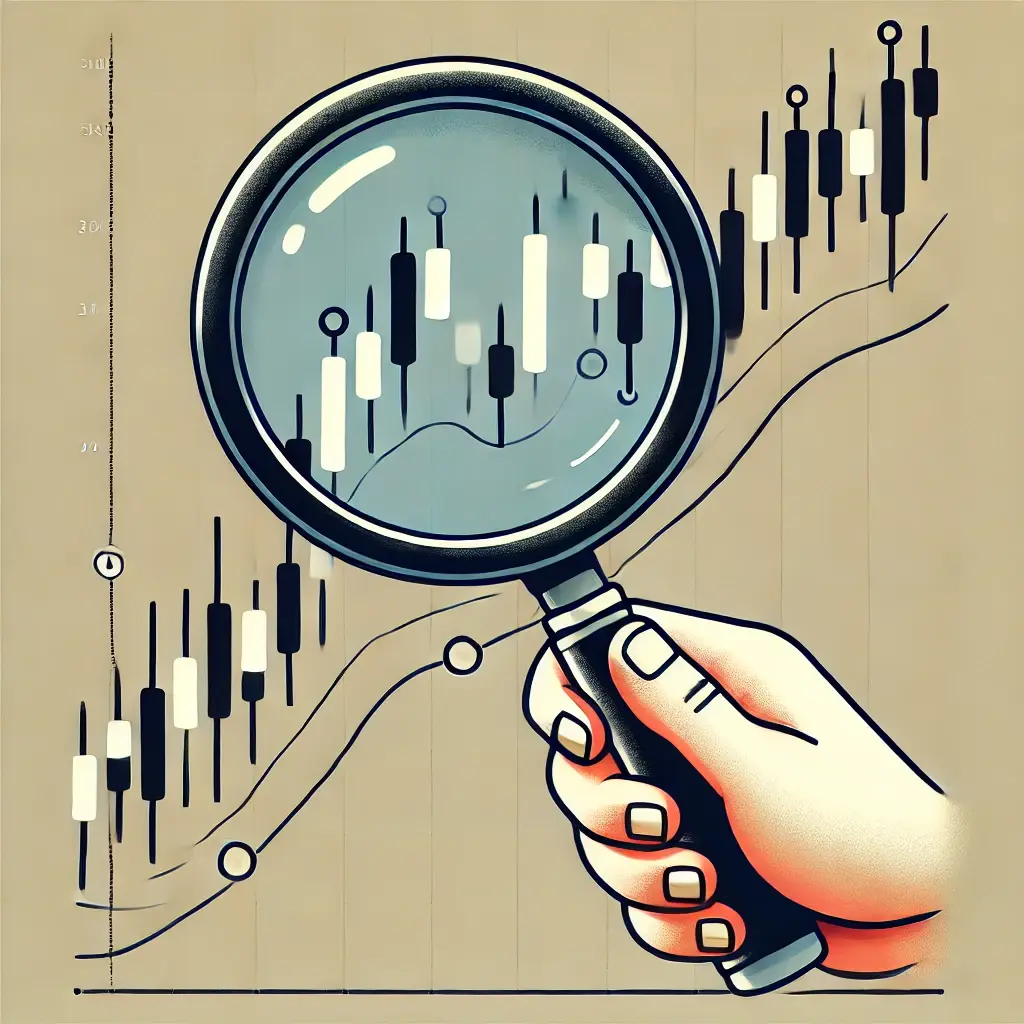
- Candlestick Chart(Noun)
- /KAN-dl-stik chahrt/
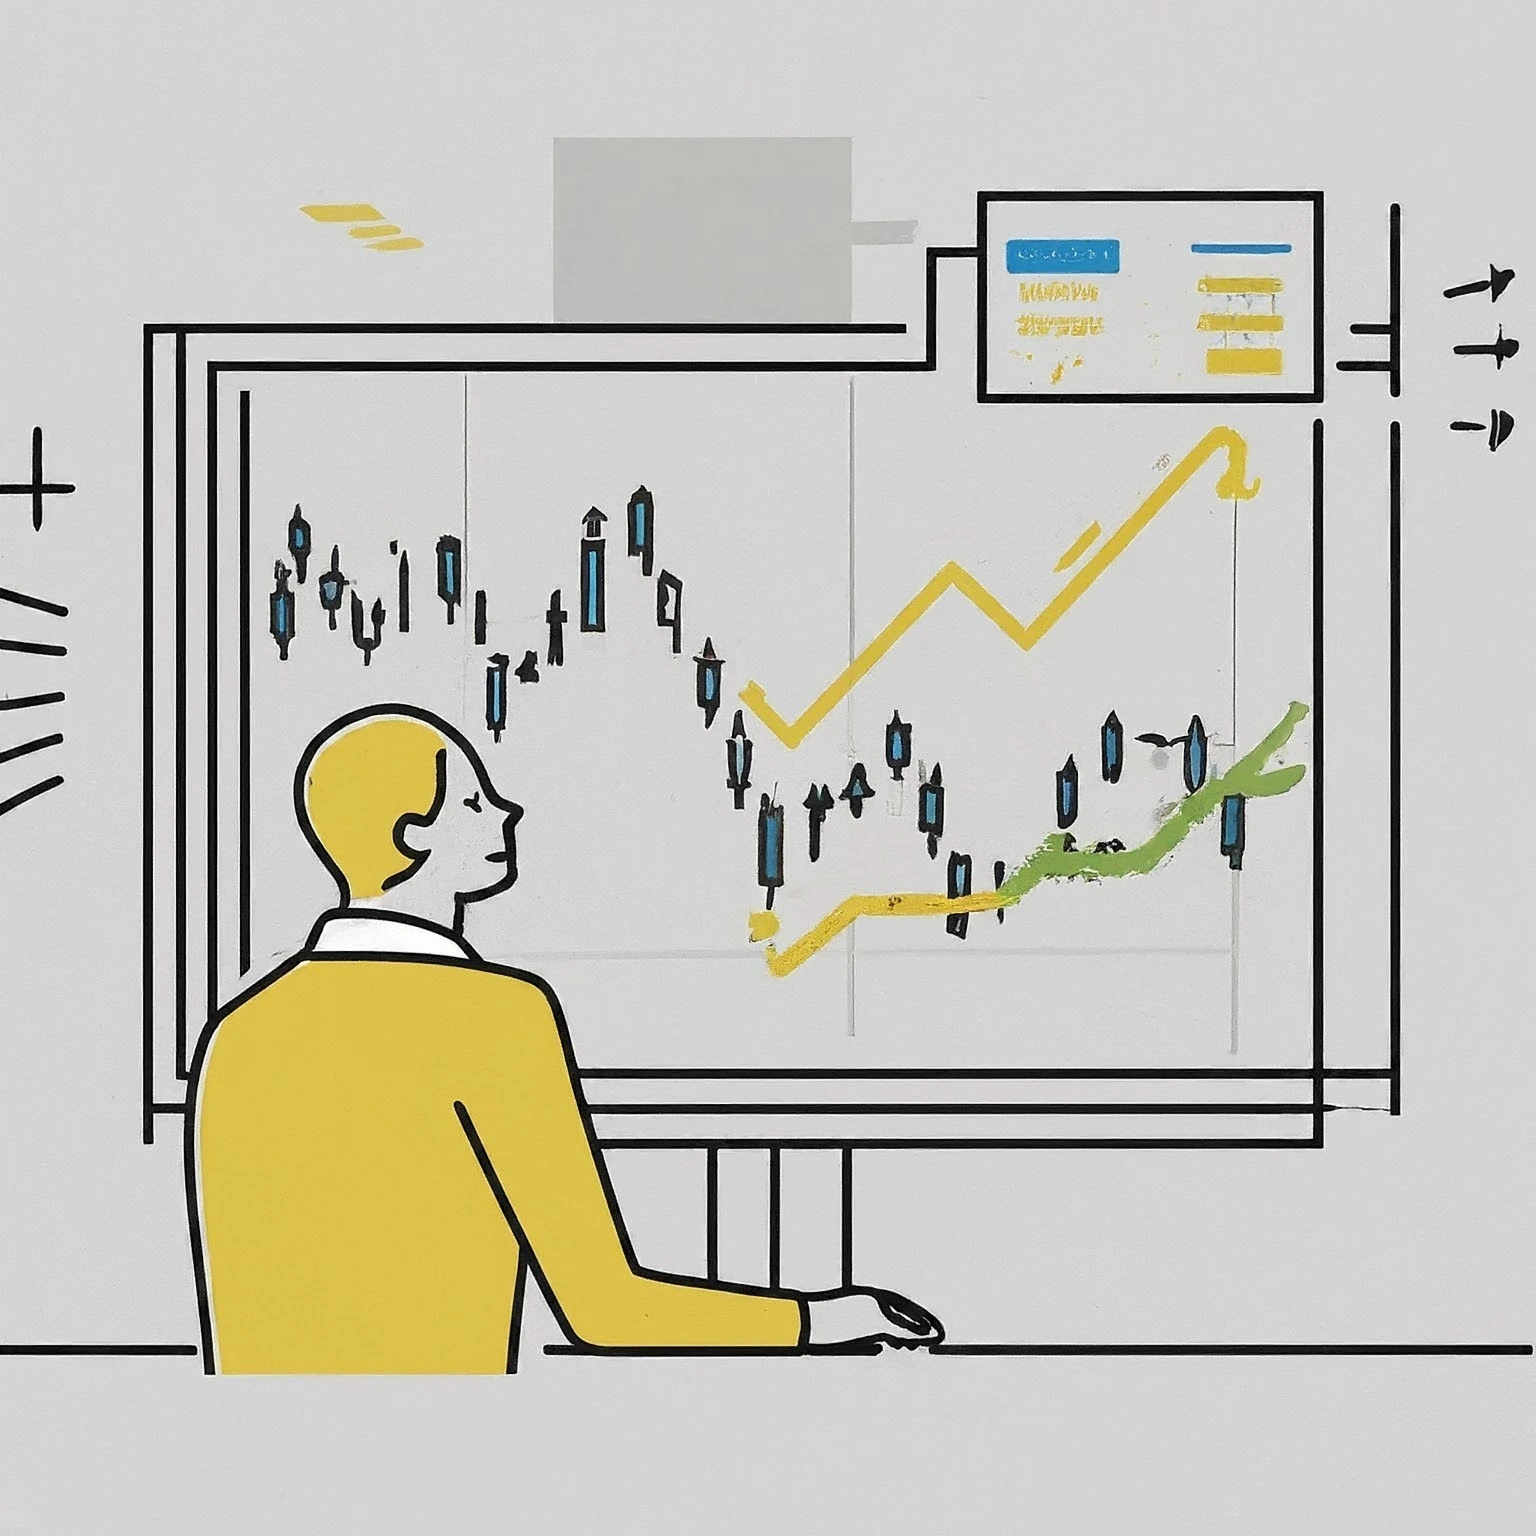
- Definition: A type of financial chart used to describe price movements of a security, derivative, or currency, using a candle-shaped figure to represent the open, high, low, and close prices.
- Etymology: "Candlestick" from Old English "candelsticca," meaning "a holder for a candle," and "chart" from Latin "charta," meaning "paper or map." This term describes a visual tool for analyzing market prices.
- Similar: Candle chart
- Opposite: Line chart
- Example: "Technical analysts often use a candlestick chart to identify potential reversal patterns in stock prices."
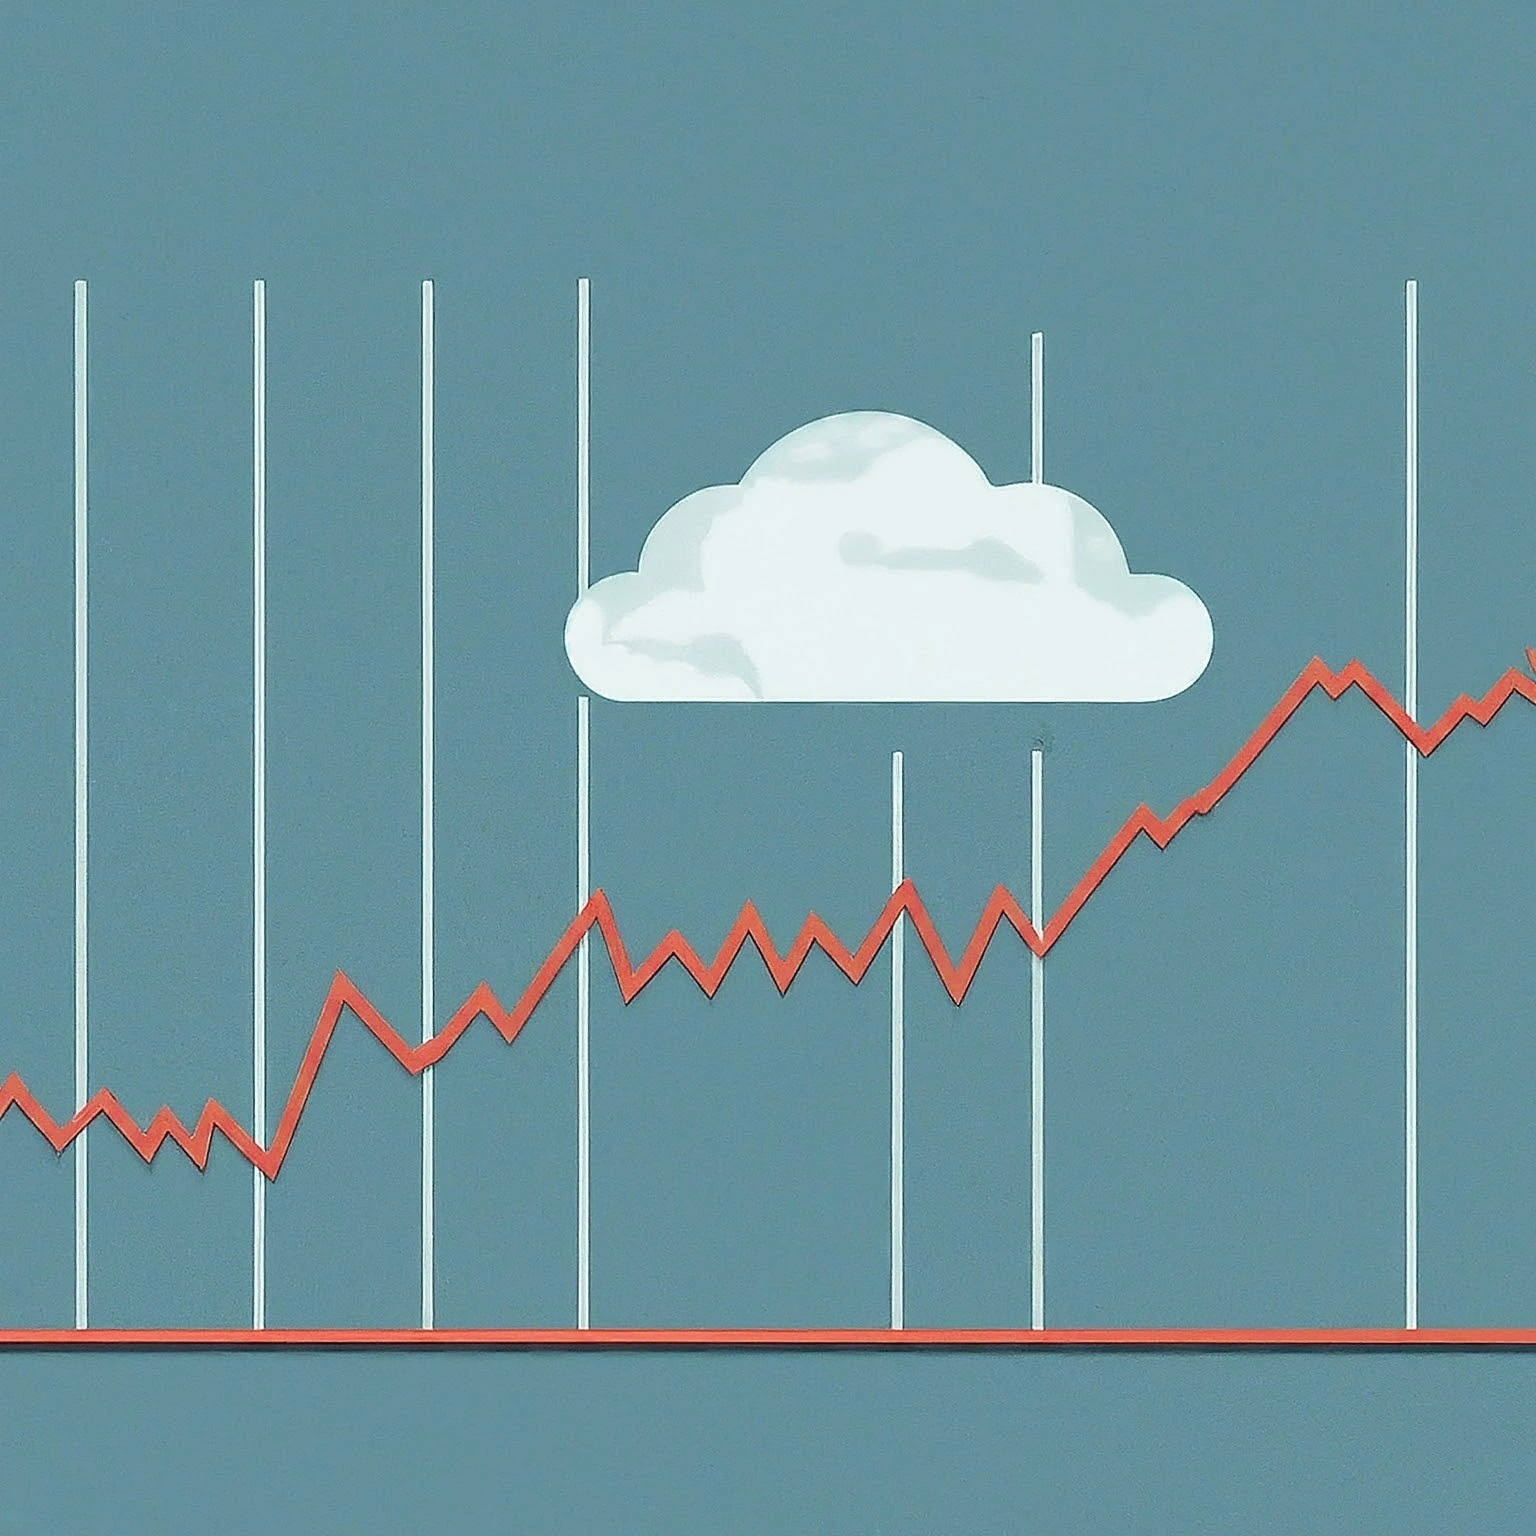
- Cash Flow(Noun)
- /: KASH floh/
- Definition: The net amount of cash being transferred into and out of a business, especially as it relates to the company's operations, investing, and financing activities.
- Etymology: "Cash" from Old French "casse," meaning "box," and "flow" from Old English "flowan," meaning "to stream." This term refers to the movement of money within a business.
- Similar: Liquidity flow
- Opposite: Cash drought
- Example: "Positive cash flow is essential for a company to sustain its operations and invest in growth."
- Correlation(Noun)
- /kor-uh-LAY-shun/
- Definition: A statistical measure that describes the extent to which two variables move in relation to each other, commonly used in finance to assess the relationship between asset prices.
- Etymology: "Correlation" from Latin "correlatio," meaning "togetherness" and "relation." This term is used in finance to describe how two securities move in relation to each other.
- Similar: Interdependence
- Opposite: Independence
- Example: "The correlation between stock prices and interest rates can help investors predict market movements."
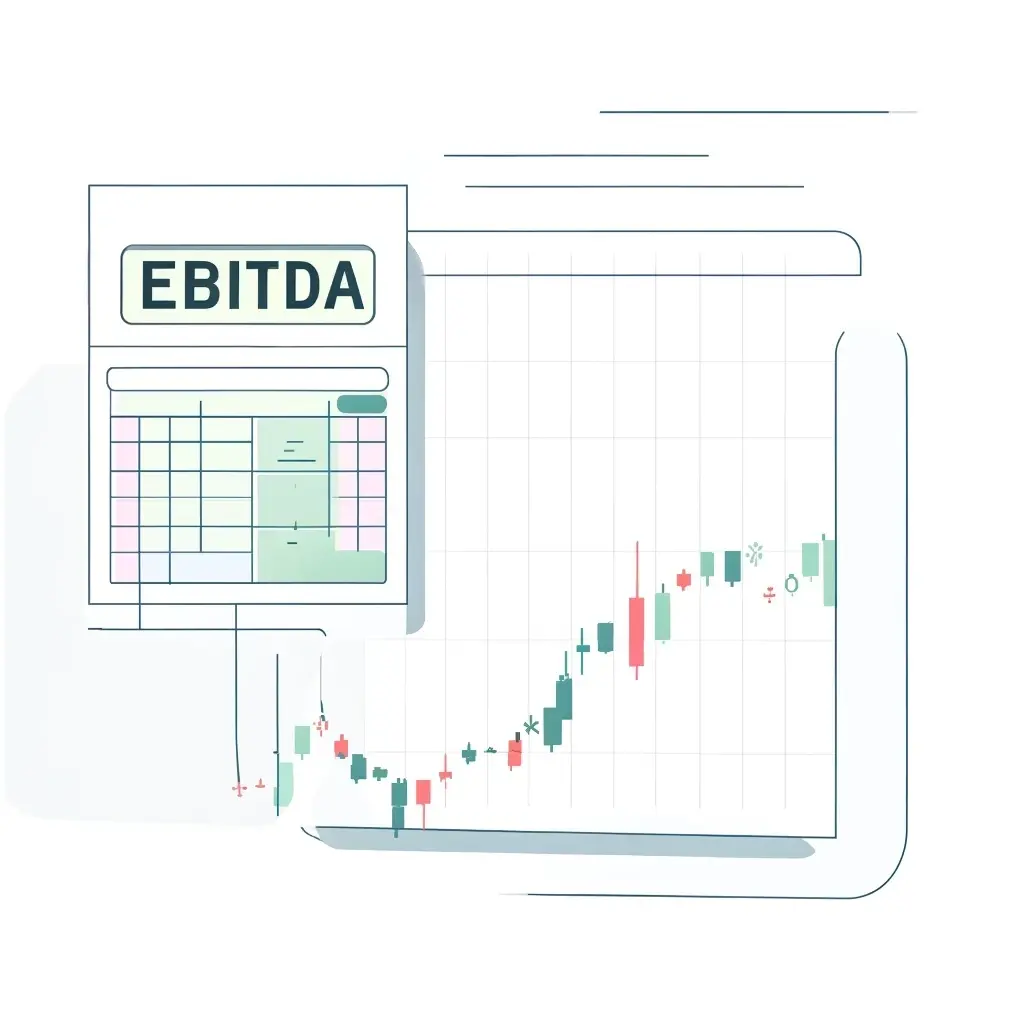
- Earnings Reports(Noun)
- /URN-ingz ri-PORTS/
- Definition: Official financial documents issued by publicly traded companies, detailing their financial performance over a specific period, typically a quarter or year, including revenues, expenses, and profits.
- Etymology: "Earnings" from Old English "earnian," meaning "to earn," and "reports" from Latin "reportare," meaning "to carry back." This term refers to regular updates on a company's financial health.
- Similar: Financial statements
- Example: "Investors closely analyze earnings reports to assess a company's financial health and future prospects."
- EPS (Earnings Per Share)(Noun)
- /E-P-S/
- Definition: A financial metric that divides a company's net profit by the number of outstanding shares of its common stock, indicating how much money a company makes per share.
- Etymology: "Earnings" from Old English "earnian," meaning "to earn," "per" from Latin "per," meaning "by," and "share" from Old English "scearu," meaning "portion." This term reflects a company's profitability on a per-share basis.
- Similar: Per-share earnings
- Opposite: Loss per share
- Example: "A rising EPS is often seen as a sign that a company is growing and becoming more profitable."
- Float Analysis(Noun)
- /floht uh-NAL-uh-sis/
- Definition: The examination of the number of shares of a company that are available for trading by the public, excluding closely held shares by insiders or major shareholders.
- Etymology: "Float" from Old English "flotian," meaning "to float," and "analysis" from Greek "analusis," meaning "a breaking up." This term refers to the study of a company’s tradable shares.
- Similar: Share float analysis
- Example: "Float analysis helps investors understand the supply of shares available for trading, which can impact stock volatility."
- GDP Growth(Noun)
- /JEE-dee-PEE grohth/
- Definition: The increase in the market value of goods and services produced by an economy over a certain period, often used as a key indicator of economic health.
- Etymology: "GDP" stands for Gross Domestic Product, and "growth" from Old English "growan," meaning "to increase." This term measures the economic progress of a country.
- Similar: Economic growth
- Opposite: Economic contraction
- Example: "Strong GDP growth is usually associated with rising stock markets and investor confidence."
- Inflation Rate(Noun)
- /in-FLAY-shun reyt/
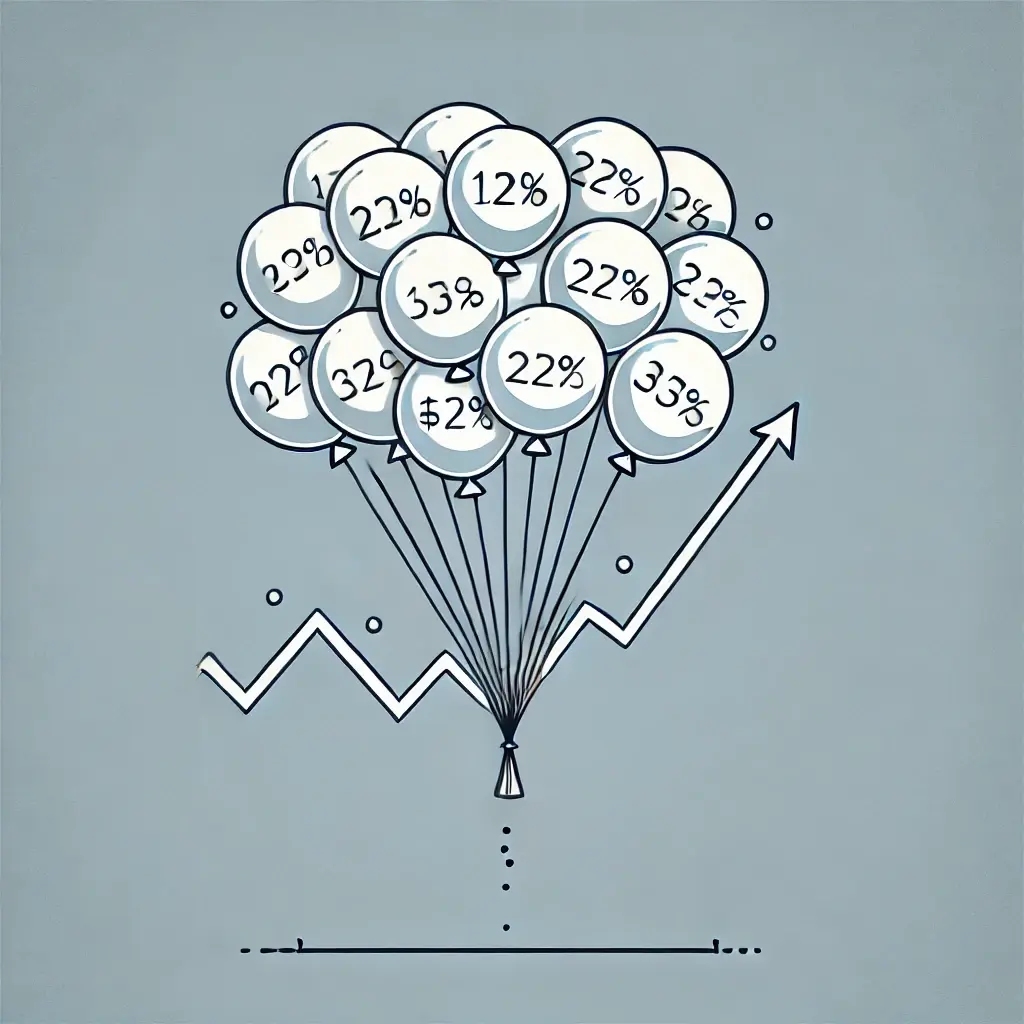
- Definition: The percentage change in the price level of a basket of goods and services over time, reflecting the rate at which the general level of prices for goods and services is rising.
- Etymology: "Inflation" from Latin "inflare," meaning "to blow into," and "rate" from Old French "rat," meaning "reckoning." This term measures the rate of increase in prices over a given period.
- Similar: Price inflation
- Opposite: Deflation rate
- Example: "Rising inflation rates can erode purchasing power and affect stock market valuations."
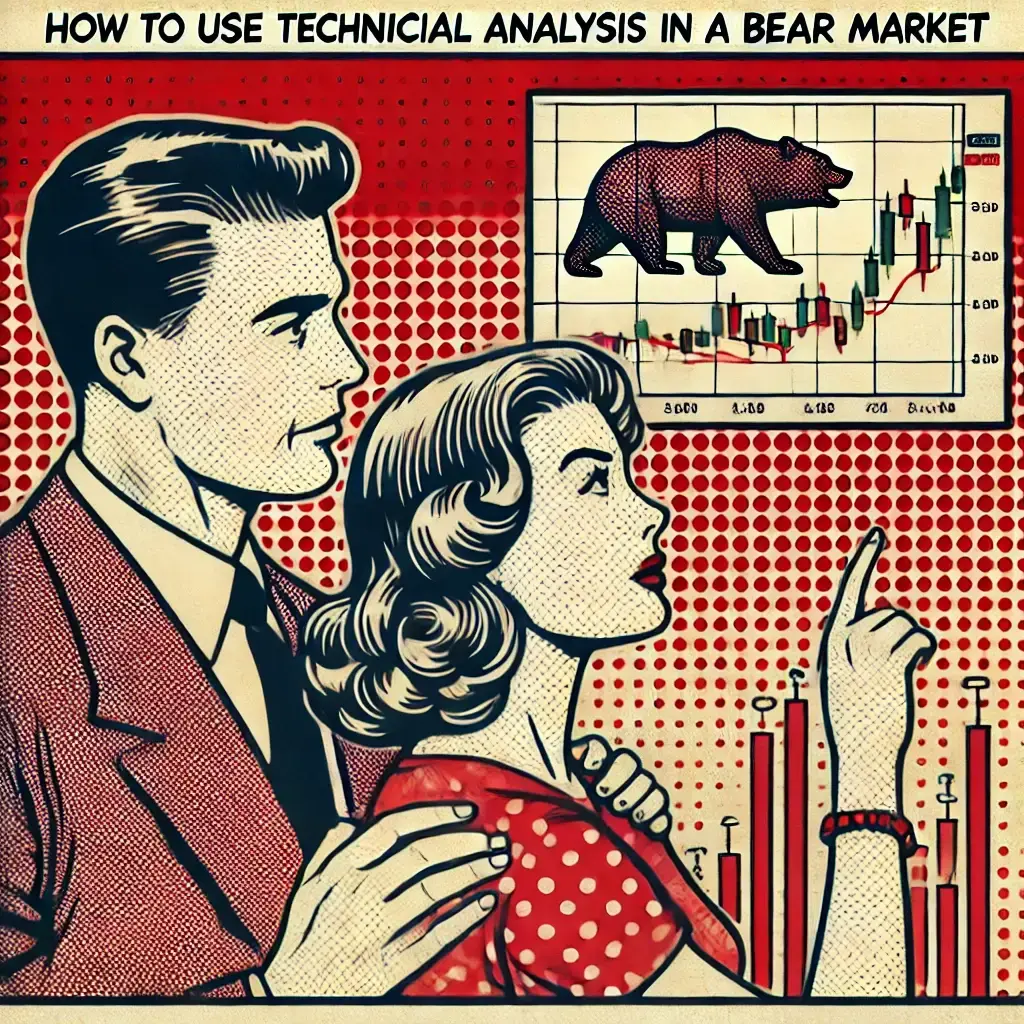
- Market Cycles(Noun)
- /MAHR-kit SAHY-kuhlz/
- Definition: The natural fluctuation of the market between periods of growth (bull markets) and decline (bear markets), influenced by economic conditions, investor sentiment, and external events.
- Etymology: "Market" from Latin "mercatus," meaning "trade," and "cycles" from Greek "kyklos," meaning "circle." This term describes the recurring phases of market expansion and contraction.
- Similar: Economic cycles
- Example: "Understanding market cycles can help investors make informed decisions about when to buy or sell assets."
- Market Trends(Noun)
- /MAHR-kit trendz/
- Definition: The general direction in which the market is moving over a period, typically identified by analyzing price movements, trading volumes, and economic indicators.
- Etymology: "Market" from Latin "mercatus," meaning "trade," and "trends" from Old English "trendan," meaning "to revolve or turn." This term refers to the patterns or directions of market movements.
- Similar: Market movements
- Opposite: Market stability
- Example: "Investors often look at long-term market trends to guide their investment strategies."
- Momentum(Noun)
- /moh-MEN-tuhm/
- Definition: The tendency of a stock to continue moving in its current direction, either upward or downward, driven by investor sentiment, earnings performance, or market conditions.
- Etymology: "Momentum" from Latin "movere," meaning "to move." In finance, it refers to the continuation of price trends based on the speed of price changes.
- Similar: Market inertia
- Opposite: Reversal
- Example: "Momentum investing involves buying stocks that have shown an upward price trend and selling those that have trended downward."
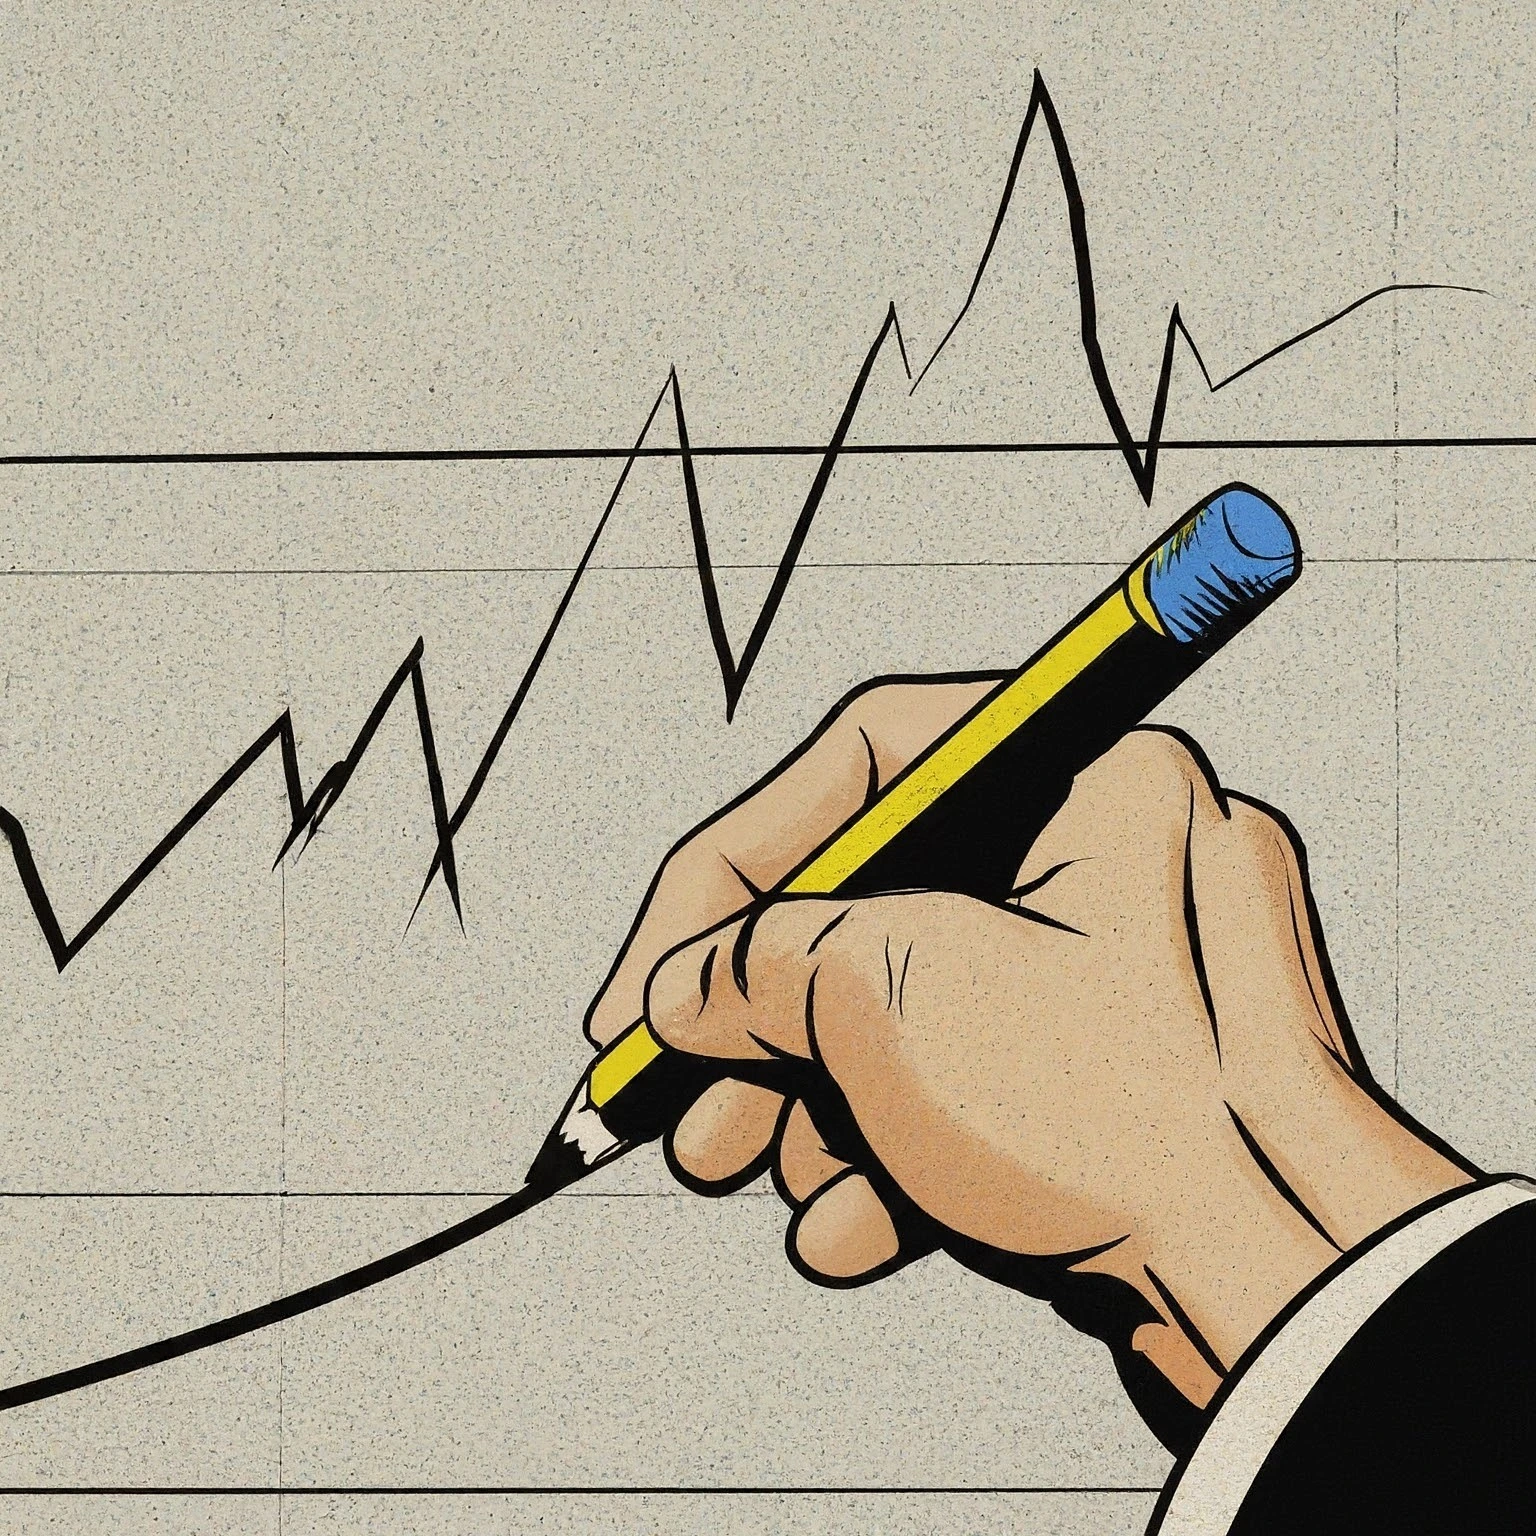
- Price Forecasting(Noun)
- /prahys FOHR-kast-ing/
- Definition: The process of predicting future stock prices based on various factors, including historical price patterns, market trends, and economic indicators.
- Etymology: "Price" from Old French "pris," meaning "value," and "forecasting" from Old English "fore," meaning "before," and "casten," meaning "to throw." This term refers to the estimation of future market prices.
- Similar: Price prediction
- Opposite: Price uncertainty
- Example: "Analysts use price forecasting models to help investors make decisions about buying or selling stocks."
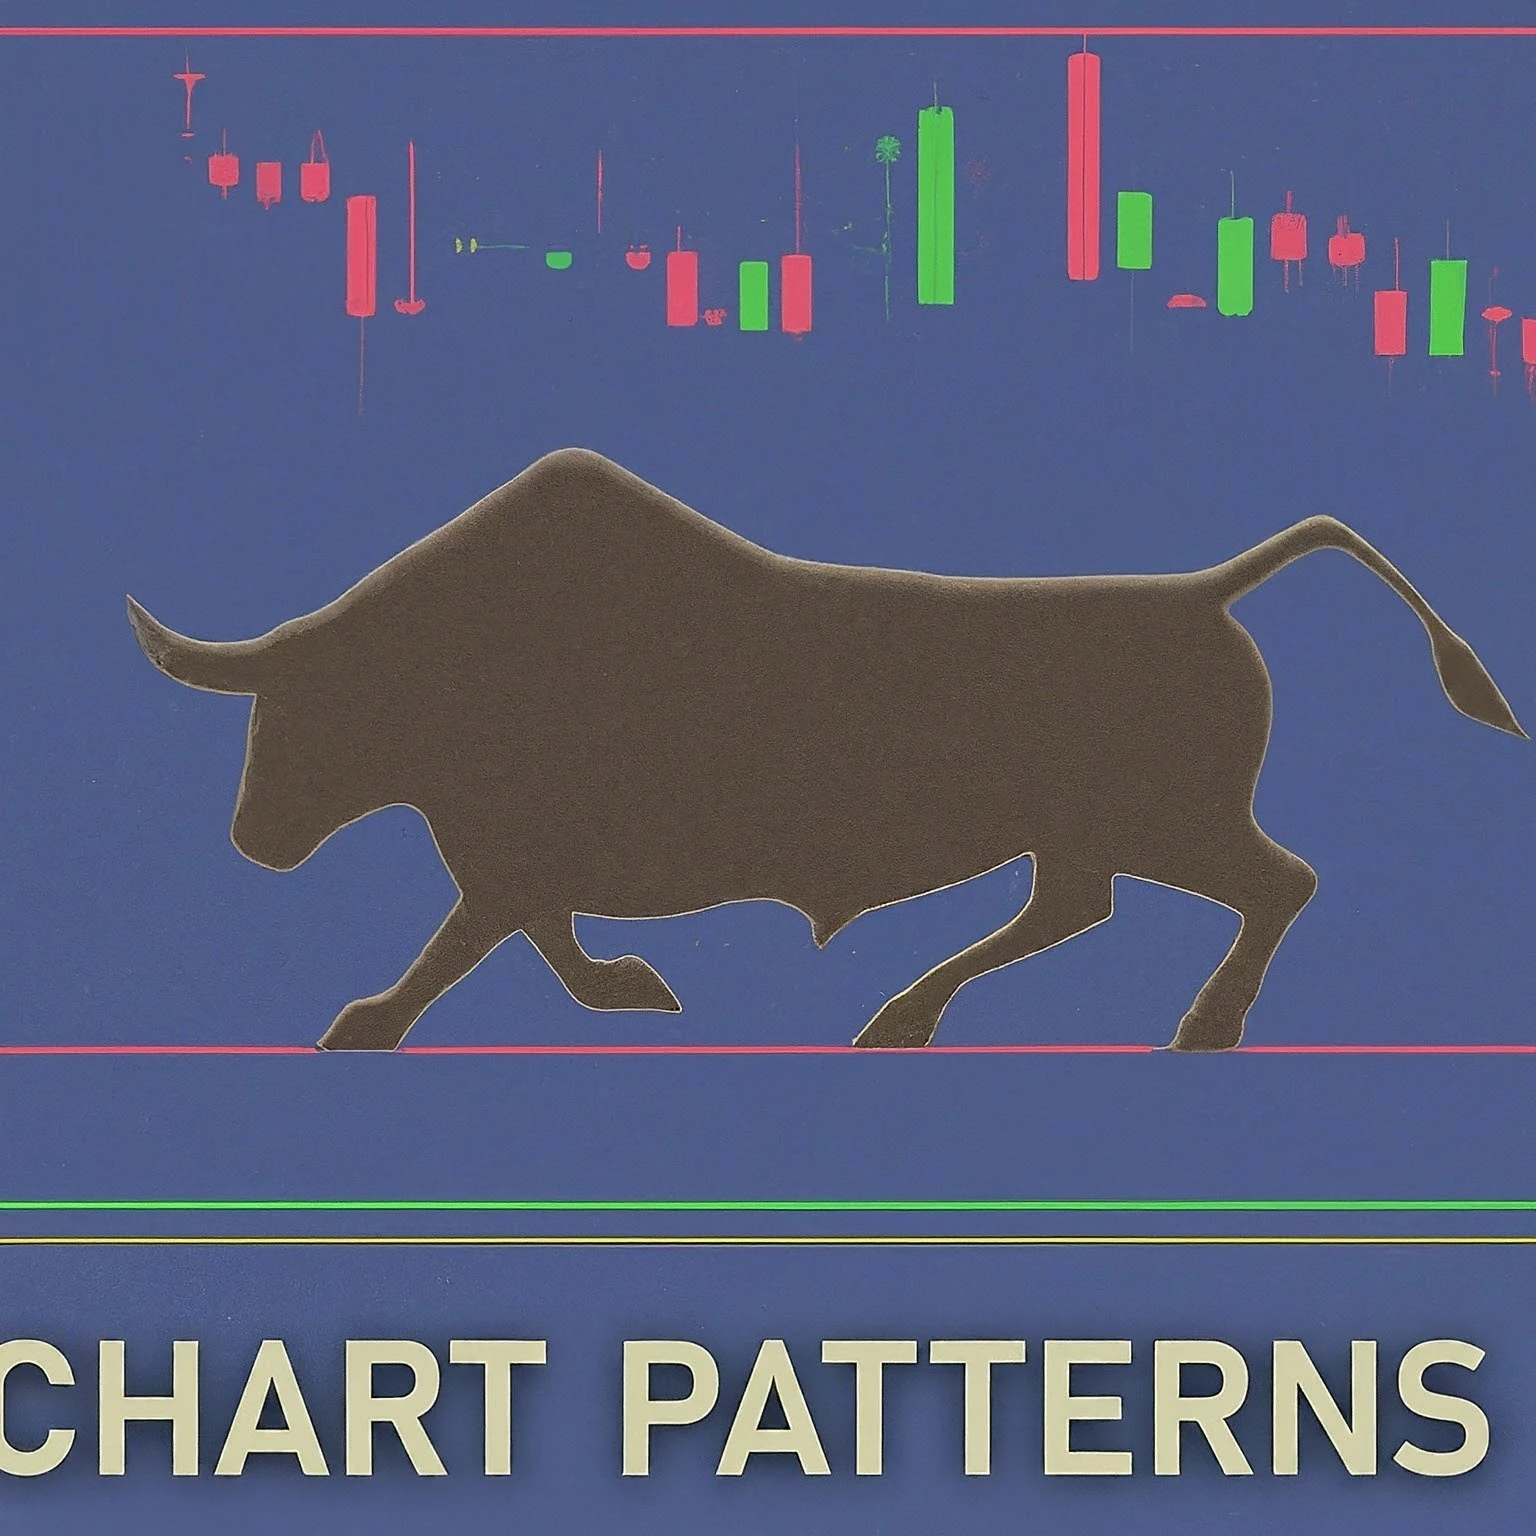
- Price Patterns(Noun)
- /prahys PAT-urnz/
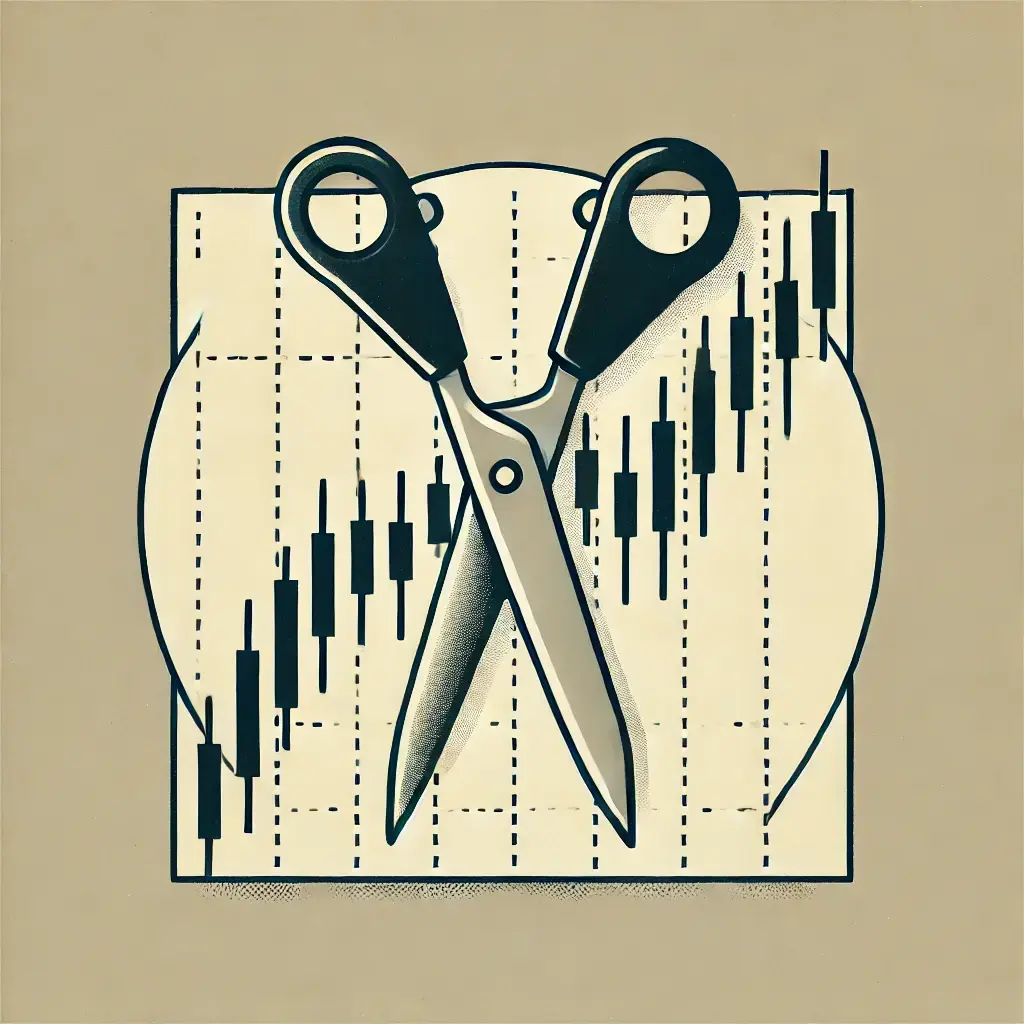
- Definition: Repeating formations in stock price charts that can indicate future market movements, used by technical analysts to predict trends and potential reversals.
- Etymology: "Price" from Old French "pris," meaning "value," and "patterns" from Old French "patron," meaning "model or guide." This term describes recurring shapes in price charts that suggest future price movements.
- Similar: Chart patterns
- Opposite: Random price movements
- Example: "Technical traders look for price patterns like head and shoulders or double tops to anticipate market reversals."
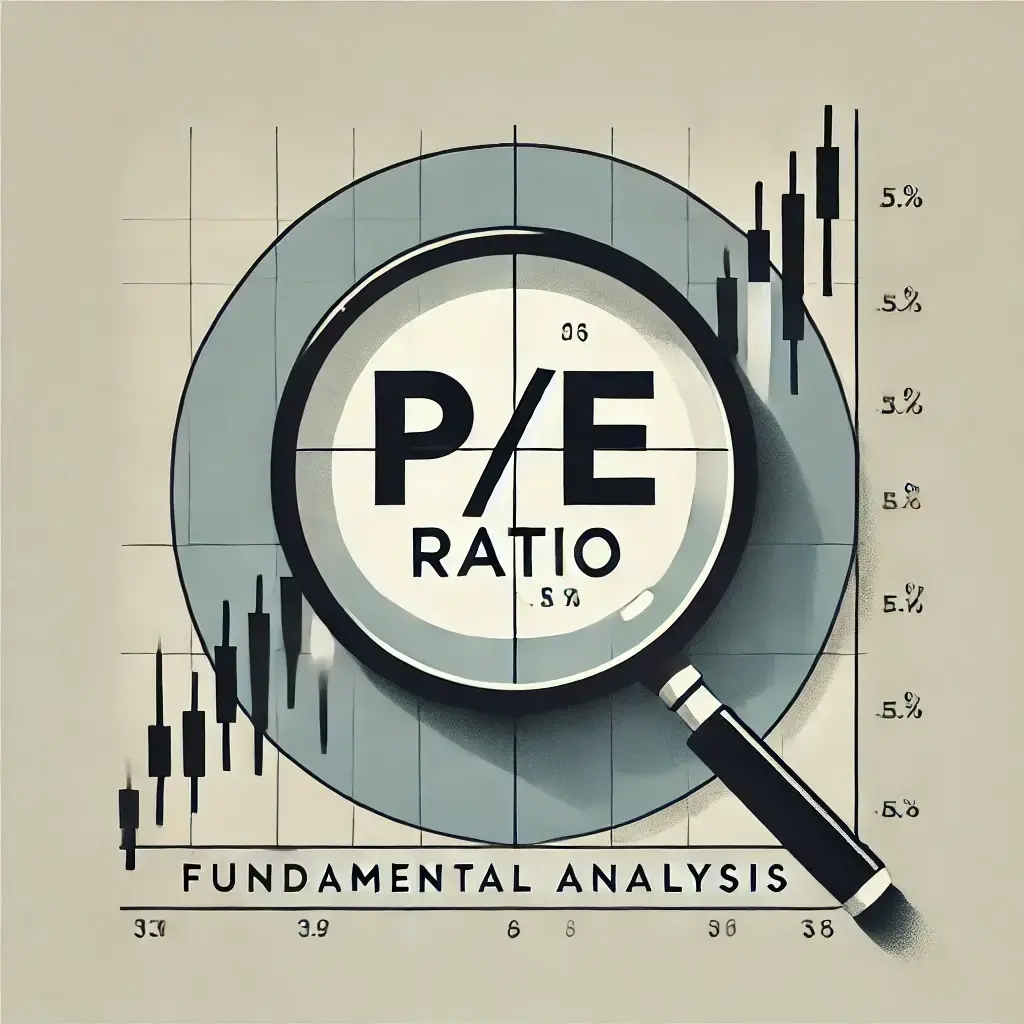
- Price-to-Book Ratio(Noun)
- /prahys-tuh-buhk rey-shoh/
- Definition: A financial valuation metric that compares a company’s market price per share to its book value per share, indicating whether a stock is undervalued or overvalued.
- Etymology: "Price" from Old French "pris," meaning "value," "to" from Old English "to," meaning "in the direction of," and "book" from Old English "boc," meaning "document." This term assesses the market value versus the accounting value of a company’s equity.
- Similar: P/B ratio
- Example: "A low price-to-book ratio might suggest that a stock is undervalued, especially in comparison to its peers."
- Rate of Return(Noun)
- /reyt uhv ri-TURN/
- Definition: The gain or loss on an investment over a specific period, expressed as a percentage of the investment’s initial cost, used to measure the profitability of an investment.
- Etymology: "Rate" from Old French "rat," meaning "reckoning," "of" from Old English "of," meaning "away from," and "return" from Old French "retourner," meaning "to turn back." This term quantifies the profitability of an investment.
- Similar: ROI (Return on Investment)
- Opposite: Loss rate
- Example: "Investors compare the rate of return on different assets to decide where to allocate their capital."
- Risk Assessment(Noun)
- /risk uh-SES-muhnt/
- Definition: The process of identifying and analyzing potential risks that could negatively impact an investment’s returns, often used to inform decision-making and risk management strategies.
- Etymology: "Risk" from Italian "risco," meaning "danger," and "assessment" from Latin "assessare," meaning "to sit by or near." This term involves evaluating the potential adverse outcomes of an investment.
- Similar: Risk evaluation
- Opposite: Risk ignorance
- Example: "Risk assessment is crucial before making any significant investment to understand potential downsides."
- Sentiment Analysis(Noun)
- /SEN-ti-muhnt uh-NAL-uh-sis/
- Definition: The use of algorithms and data analysis to gauge the mood or sentiment of investors based on news articles, social media, and other public communications, often used to predict market movements.
- Etymology: "Sentiment" from Latin "sentire," meaning "to feel," and "analysis" from Greek "analusis," meaning "a breaking up." This term involves examining public sentiment to forecast market trends.
- Similar: Market mood analysis
- Opposite: Fundamental analysis
- Example: "Sentiment analysis revealed a bullish outlook among investors, which supported a rise in stock prices."
- Stock Odds(Noun)
- /stok odz/
- Definition: The probability or likelihood of a stock’s price moving in a particular direction, often calculated using historical data and statistical analysis to help investors assess potential outcomes.
- Etymology: "Stock" from Old English "stocc," meaning "fund," and "odds" from Old Norse "odds," meaning "a point or difference." This term refers to the chances or likelihood of a specific price movement occurring in a stock.
- Similar: Stock probabilities
- Example: "Traders often consider stock odds when making decisions about which stocks to buy or sell, aiming to improve their chances of success."
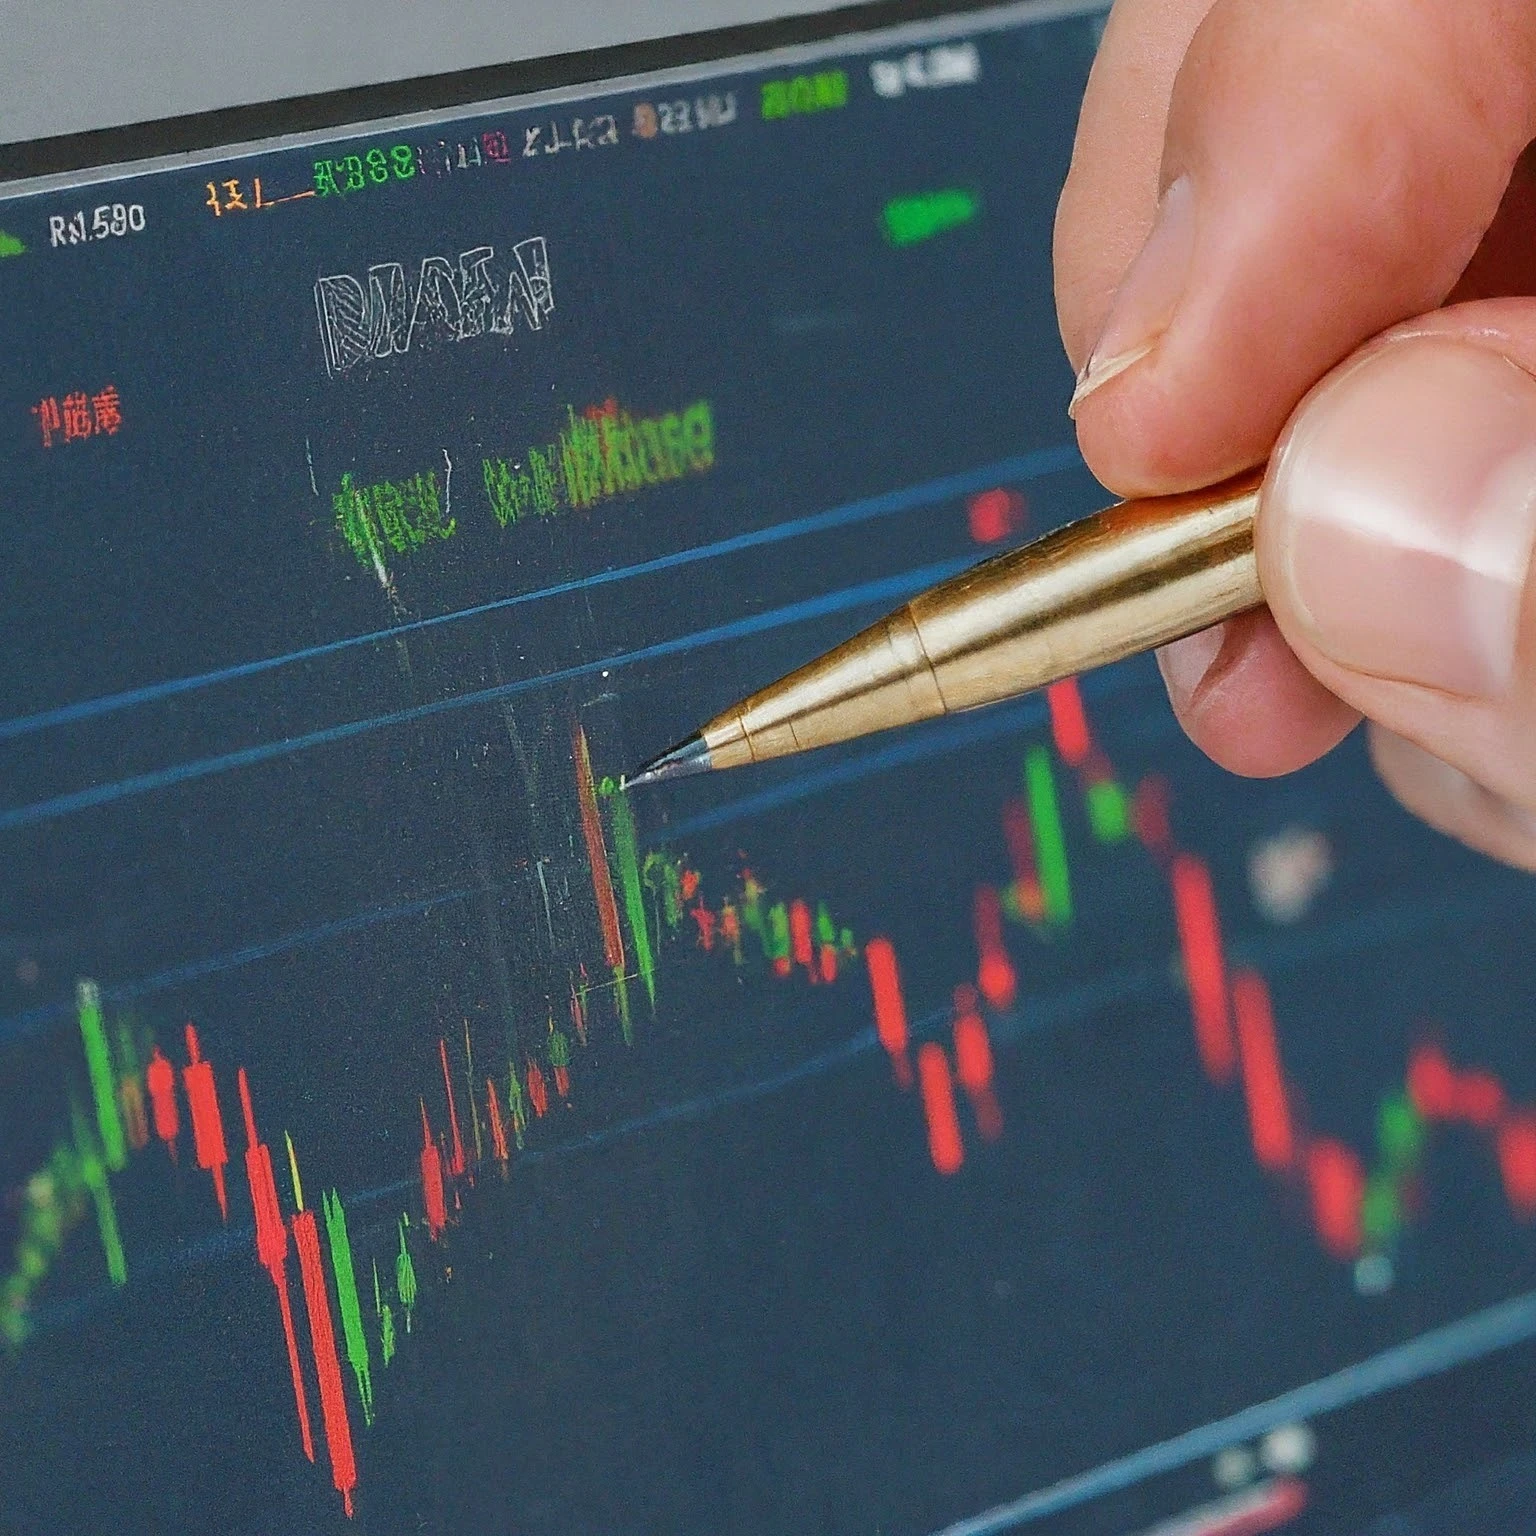
- Technical Analysis(Noun)
- /TEK-ni-kuhl uh-NAL-uh-sis/
- Definition: The study of past market data, primarily price and volume, to forecast future price movements, using charts and other tools to identify patterns and trends.
- Etymology: "Technical" from Greek "tekhnikos," meaning "skilled in art," and "analysis" from Greek "analusis," meaning "a breaking up." This term refers to the method of predicting future market movements based on historical data.
- Similar: Chart analysis
- Opposite: Fundamental analysis
- Example: "Traders rely on technical analysis to make short-term trading decisions based on historical price patterns."
- Trend Line(Noun)
- /trend lahyn/
- Definition: A straight line drawn on a price chart to connect two or more price points, typically used to identify the direction of the market or a specific stock’s movement over time.
- Etymology: "Trend" from Old English "trendan," meaning "to revolve or turn," and "line" from Latin "linea," meaning "string or thread." This term describes a graphical tool used in technical analysis to indicate the trend direction.
- Similar: Trend indicator
- Example: "A rising trend line on the chart suggests that the stock is in an upward trend."