- Accumulation Pattern(Noun)
- /uh-KYOO-myuh-lay-shun PAT-urn/
- Definition: A chart pattern that indicates the gradual buying of a stock by institutional investors, leading to a consolidation phase before a potential upward price movement.
- Etymology: "Accumulation" from Latin "accumulare," meaning "to heap up," and "pattern" from Old French "patron," meaning "model or guide." This term refers to a phase where a stock is being accumulated by buyers, usually leading to an upward breakout.
- Similar: Accumulation phase
- Opposite: Distribution pattern
- Example: "Traders often look for accumulation patterns to identify potential buying opportunities before a stock's price increases."
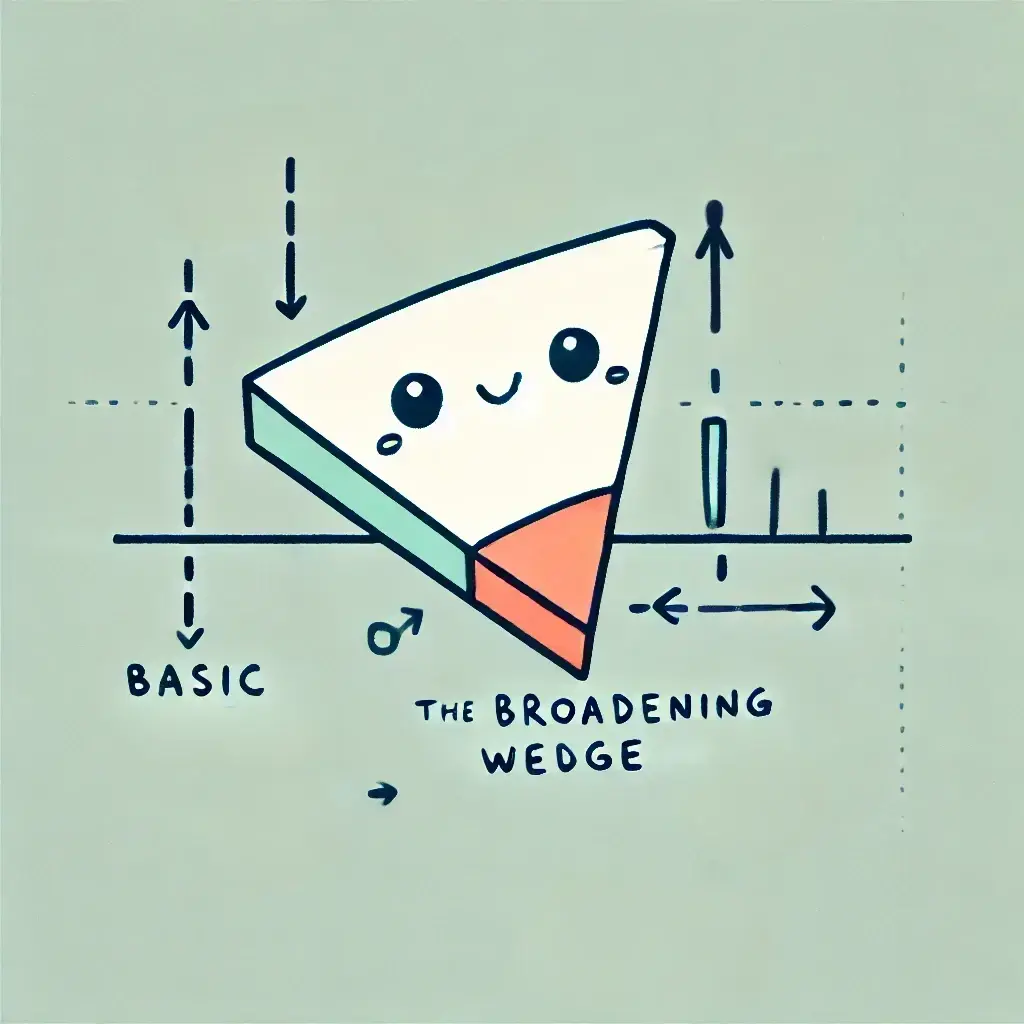
- Ascending Broadening Wedge(Noun)
- /uh-SEND-ing BRAWD-uhn-ing wehj/
- Definition: A chart pattern characterized by a widening price range and higher highs, often seen as a bearish reversal signal after an uptrend when the pattern occurs at the top of a price movement.
- Etymology: "Ascending" from Latin "ascendere," meaning "to climb up," "broadening" from Old English "brædan," meaning "to make broad," and "wedge" from Old English "wecg," meaning "a piece of wood or metal used to split." This term describes a price pattern that widens as prices move higher, often leading to a downward reversal.
- Similar: Rising broadening wedge
- Opposite: Descending broadening wedge
- Example: "An ascending broadening wedge often signals a potential bearish reversal after an extended uptrend."
- Ascending Channel(Noun)
- /uh-SEND-ing CHAN-ul/
- Definition: A bullish chart pattern where the price moves between two parallel upward-sloping trend lines, indicating a strong uptrend with higher highs and higher lows.
- Etymology: "Ascending" from Latin "ascendere," meaning "to climb up," and "channel" from Old French "chanel," meaning "a canal or groove." This term describes a trading range where prices consistently rise within parallel boundaries.
- Similar: Rising channel
- Opposite: Descending channel
- Example: "The stock's price formed an ascending channel, suggesting a sustained uptrend with consistent buying interest."
- Ascending Triangle(Noun)
- /uh-SEND-ing TRY-ang-gul/
- Definition: A bullish chart pattern formed by a horizontal resistance line and an ascending trend line connecting higher lows, indicating potential for an upward breakout.
- Etymology: "Ascending" from Latin "ascendere," meaning "to climb up," and "triangle" from Greek "triangulum," meaning "three angles." This term describes a chart pattern that signals increasing buying pressure and the likelihood of a breakout above resistance.
- Similar: Rising triangle
- Opposite: Descending triangle
- Example: "The formation of an ascending triangle suggests that buyers are gaining control, and a breakout above resistance could lead to higher prices."
- Ascending Triangle Breakout(Noun)
- /uh-SEND-ing TRY-ang-gul BRAYK-out/
- Definition: The event when the price breaks above the horizontal resistance line of an ascending triangle pattern, confirming a bullish move and potential for further upward momentum.
- Etymology: "Ascending" from Latin "ascendere," "triangle" from Greek "triangulum," meaning "three angles," and "breakout" from Old English "brecan," meaning "to break." This term describes the upward price movement that confirms a bullish breakout from the ascending triangle pattern.
- Similar: Bullish triangle breakout
- Opposite: Triangle breakdown
- Example: "The ascending triangle breakout was accompanied by high volume, confirming the bullish sentiment and a potential price surge."
- Bearish Breakdown(Noun)
- /BEAR-ish BRAYK-down/
- Definition: A technical event where the price of a security falls below a key support level, signaling a potential downtrend or continuation of a bearish market movement.
- Etymology: "Bearish" from Old English "bera," meaning "bear" (symbolizing a downward market), and "breakdown" from Old English "brecan," meaning "to break." This term refers to a downward movement below a significant support level, indicating further price declines.
- Similar: Bearish collapse
- Opposite: Bullish breakout
- Example: "The bearish breakdown below the $50 support level triggered a wave of selling pressure."
- Bearish Engulfing(Noun)
- /BEAR-ish in-GUHL-fing/
- Definition: A candlestick pattern where a large bearish candle completely engulfs the previous smaller bullish candle, signaling a potential reversal from an uptrend to a downtrend.
- Etymology: "Bearish" from Old English "bera," meaning "bear," and "engulfing" from Old French "engolfer," meaning "to swallow up." This term describes a reversal pattern where sellers overpower buyers, leading to a price decline.
- Similar: Bearish reversal
- Opposite: Bullish engulfing
- Example: "The bearish engulfing pattern on the daily chart suggested that the stock might be headed lower after a brief rally."
- Bearish Flag(Noun)
- /BEAR-ish flag/
- Definition: A chart pattern that forms during a downtrend, characterized by a brief consolidation in a narrow range before the price continues to move lower, resembling a flag on a pole.
- Etymology: "Bearish" from Old English "bera," meaning "bear," and "flag" from Old English "flagge," meaning "banner or ensign." This term describes a continuation pattern where a brief pause in a downtrend is followed by further price declines.
- Similar: Bearish continuation pattern
- Opposite: Bullish flag
- Example: "The bearish flag indicated that the stock was likely to continue its downward trend after a short consolidation period."
- Bearish Harami(Noun)
- /BEAR-ish huh-RAH-mee/
- Definition: A candlestick pattern where a small bearish candle is contained within the body of the preceding larger bullish candle, suggesting a potential reversal to a downtrend.
- Etymology: "Bearish" from Old English "bera," meaning "bear," and "harami" from Japanese, meaning "pregnant." This term refers to a reversal pattern that hints at a change in market direction from bullish to bearish.
- Similar: Bearish reversal pattern
- Opposite: Bullish harami
- Example: "The appearance of a bearish harami on the chart indicated that the recent uptrend might be losing momentum."
- Bearish Pennant(Noun)
- /BEAR-ish PEN-uhnt/
- Definition: A continuation pattern that forms after a significant downward move, characterized by a small symmetrical triangle that consolidates before the price breaks lower.
- Etymology: "Bearish" from Old English "bera," meaning "bear," and "pennant" from Old French "penon," meaning "flag or banner." This term describes a brief consolidation in a downtrend before the continuation of the downward movement.
- Similar: Bearish continuation pattern
- Opposite: Bullish pennant
- Example: "The bearish pennant suggested that the stock was likely to continue its decline after a brief period of consolidation."
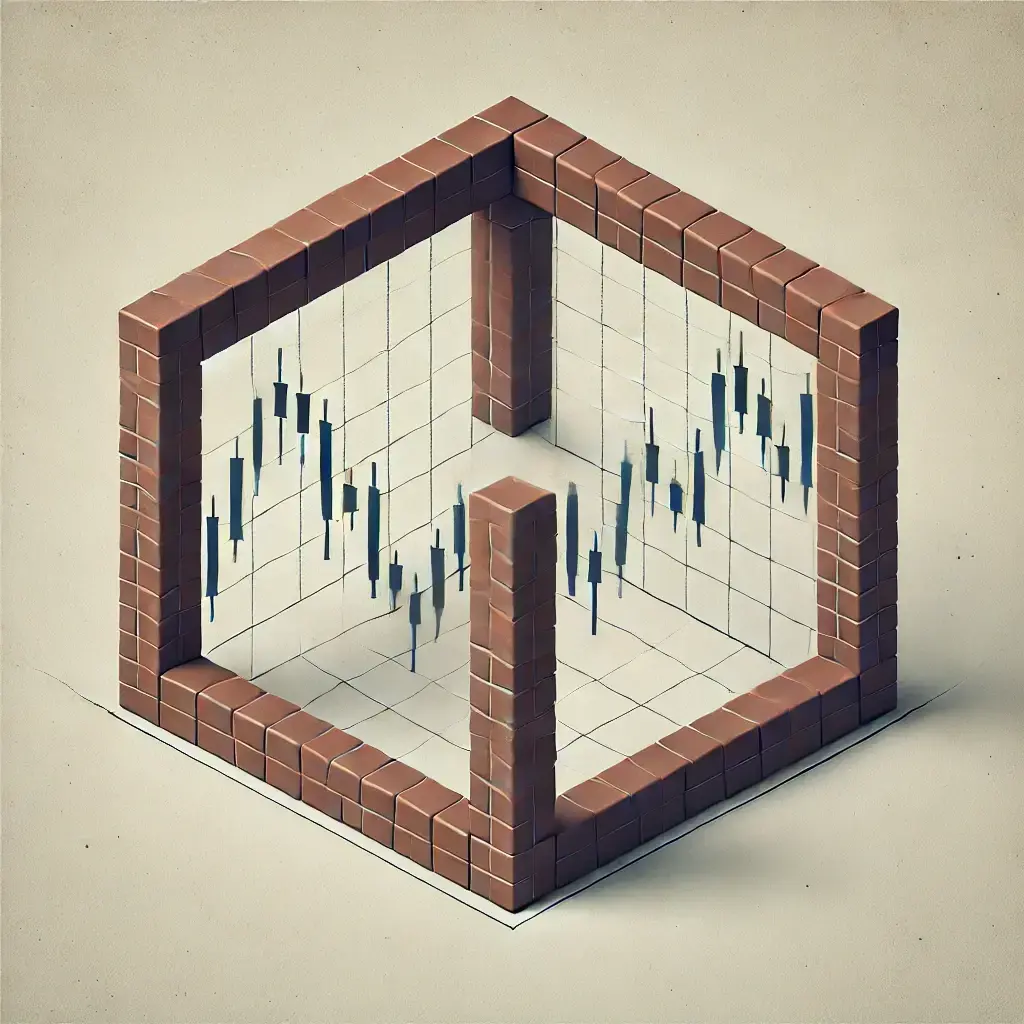
- Bearish Rectangle(Noun)
- /BEAR-ish REK-tang-gul/
- Definition: A chart pattern that forms during a downtrend, where the price moves sideways between two parallel support and resistance levels before breaking downwards.
- Etymology: "Bearish" from Old English "bera," meaning "bear," and "rectangle" from Latin "rectangulus," meaning "right angle." This term refers to a consolidation phase within a downtrend, followed by a continuation of the downward movement.
- Similar: Bearish consolidation
- Opposite: Bullish rectangle
- Example: "The bearish rectangle pattern signaled that the stock might break below support and continue its downward trend."
- Bilateral Pattern(Noun)
- /BY-lat-er-ul PAT-urn/
- Definition: A chart pattern that can result in either a continuation of the existing trend or a reversal, depending on which direction the price breaks out.
- Etymology: "Bilateral" from Latin "bilateralis," meaning "having two sides," and "pattern" from Old French "patron," meaning "model or guide." This term describes a pattern with the potential to move in either direction.
- Similar: Ambiguous pattern
- Opposite: Unilateral pattern
- Example: "Traders should watch for a breakout in either direction when a bilateral pattern forms."
- Breakdown(Noun)
- /BRAYK-down/
- Definition: The movement of a stock's price below a significant support level, signaling potential further declines.
- Etymology: "Breakdown" from Old English "brecan," meaning "to break," and "down" from Old English "dun," meaning "hill." This term refers to the breach of a support level, often indicating a bearish trend.
- Similar: Support breach
- Opposite: Breakout
- Example: "The stock's breakdown below $50 confirmed the bearish trend."
- Broadening Wedge(Noun)
- /BRAWD-uh-ning wehj/
- Definition: A chart pattern where the price range widens over time, forming diverging trend lines, which can signal either a continuation or a reversal depending on the trend direction.
- Etymology: "Broadening" from Old English "brædan," meaning "to make broad," and "wedge" from Old English "wecg," meaning "a piece of wood or metal used to split." This term describes a price pattern that widens as prices move, forming a wedge shape.
- Similar: Expanding wedge
- Opposite: Contracting wedge
- Example: "The broadening wedge pattern indicated increased volatility, with potential for either a breakout or a breakdown."
- Bullish Breakout(Noun)
- /BUL-lish BRAYK-out/
- Definition: The upward movement of a stock's price beyond a resistance level, signaling the start of a potential uptrend.
- Etymology: "Bullish" from Old English "bula," meaning "bull," and "breakout" from Old English "brecan," meaning "to break." This term describes a move above resistance, often indicating further gains.
- Similar: Upward breakout
- Opposite: Bearish breakdown
- Example: "A bullish breakout above $100 suggests the stock could continue to rise."
- Bullish Engulfing(Noun)
- /BUL-lish in-GUHL-fing/
- Definition: A candlestick pattern where a large bullish candle completely engulfs the previous smaller bearish candle, indicating a potential reversal to an uptrend.
- Etymology: "Bullish" from Old English "bula," meaning "bull," and "engulfing" from Old French "engolfer," meaning "to swallow up." This term signals that buyers have overpowered sellers, suggesting a price increase.
- Similar: Bullish reversal
- Opposite: Bearish engulfing
- Example: "The bullish engulfing pattern on the chart indicated a possible trend reversal to the upside."
- Bullish Flag(Noun)
- /BUL-lish flag/
- Definition: A continuation pattern that forms after a strong upward move, characterized by a brief consolidation in a downward-sloping channel before the price resumes its uptrend.
- Etymology: "Bullish" from Old English "bula," meaning "bull," and "flag" from Old English "flagge," meaning "banner or ensign." This term describes a temporary pause in a bullish trend before the price continues upward.
- Similar: Bullish continuation pattern
- Opposite: Bearish flag
- Example: "The bullish flag suggested that the stock could continue its rally after a brief consolidation."
- Bullish Harami(Noun)
- /BUL-lish huh-RAH-mee/
- Definition: A candlestick pattern where a small bullish candle is contained within the body of the preceding larger bearish candle, indicating a potential reversal to an uptrend.
- Etymology: "Bullish" from Old English "bula," meaning "bull," and "harami" from Japanese, meaning "pregnant." This term suggests a potential bullish reversal after a downtrend.
- Similar: Bullish reversal pattern
- Opposite: Bearish harami
- Example: "The appearance of a bullish harami pattern indicated that the recent downtrend might be losing momentum."
- Bullish Pennant(Noun)
- /BUL-lish PEN-uhnt/
- Definition: A continuation pattern that forms after a significant upward move, characterized by a small symmetrical triangle that consolidates before the price breaks higher.
- Etymology: "Bullish" from Old English "bula," meaning "bull," and "pennant" from Old French "penon," meaning "flag or banner." This term describes a brief consolidation in an uptrend followed by further price increases.
- Similar: Bullish continuation pattern
- Opposite: Bearish pennant
- Example: "The bullish pennant suggested that the stock was likely to continue its upward trend after a short consolidation."
- Bullish Rectangle(Noun)
- /BUL-lish REK-tang-gul/
- Definition: A chart pattern that forms during an uptrend, where the price moves sideways between two parallel support and resistance levels before breaking upwards.
- Etymology: "Bullish" from Old English "bula," meaning "bull," and "rectangle" from Latin "rectangulus," meaning "right angle." This term describes a consolidation phase within an uptrend, followed by a continuation of the upward movement.
- Similar: Bullish consolidation
- Opposite: Bearish rectangle
- Example: "The bullish rectangle pattern indicated that the stock might break above resistance and continue its upward trend."
- Bump and Run(Noun)
- /buhmp and ruhn/
- Definition: A chart pattern that typically forms after a rapid price increase (bump), followed by a pullback (run), and then a continuation of the original trend.
- Etymology: "Bump" from Middle English "bump," meaning "to strike," and "run" from Old English "rinnan," meaning "to flow." This term describes a pattern where an initial sharp movement is followed by a correction and then a continuation of the trend.
- Similar: Bump-and-run reversal
- Example: "The bump and run pattern suggested that the stock could continue its previous trend after a brief correction."
- Channel(Noun)
- /CHAN-ul/
- Definition: A chart pattern where the price moves between two parallel trend lines, either upward (ascending channel) or downward (descending channel), indicating a sustained trend within the channel boundaries.
- Etymology: "Channel" from Old French "chanel," meaning "a canal or groove." This term refers to a range-bound price movement within parallel trend lines.
- Similar: Trading channel
- Example: "The stock traded within a well-defined channel, offering opportunities to buy at the lower trend line and sell at the upper trend line."
- Confluence(Noun)
- /KON-floo-uhns/
- Definition: The intersection of multiple technical indicators, trend lines, or chart patterns at a specific price point, often indicating a strong level of support or resistance.
- Etymology: "Confluence" from Latin "confluentia," meaning "a flowing together." This term describes the convergence of different technical factors that strengthen the significance of a price level.
- Similar: Intersection point
- Opposite: Divergence
- Example: "The confluence of the 50-day moving average and a key support level made this price point a strong buying opportunity."
- Continuation Pattern(Noun)
- /kon-tin-YOO-ay-shun PAT-urn/
- Definition: A chart pattern that indicates a pause in the current trend, which is likely to continue in the same direction once the pattern is completed.
- Etymology: "Continuation" from Latin "continuare," meaning "to join together," and "pattern" from Old French "patron," meaning "model or guide." This term refers to patterns that suggest the existing trend will persist.
- Similar: Trend continuation
- Opposite: Reversal pattern
- Example: "A bullish flag is a type of continuation pattern that suggests the uptrend will resume after a brief consolidation."
- Cup with Handle(Noun)
- /kuhp with HAN-dul/
- Definition: A bullish continuation pattern that resembles a cup followed by a small consolidation (the handle), indicating a potential breakout above the handle.
- Etymology: "Cup" from Old English "cuppe," meaning "a small vessel," and "handle" from Old English "handlian," meaning "to touch or hold." This term describes a pattern that looks like a teacup with a handle, signaling a potential bullish breakout.
- Similar: Cup and handle
- Example: "The cup with handle pattern on the chart suggested a bullish breakout was imminent."
- Dark Cloud Cover(Noun)
- /dark klowd KUH-ver/
- Definition: A bearish reversal candlestick pattern where a bullish candle is followed by a bearish candle that opens above the previous candle's close and closes below its midpoint, indicating a potential downtrend.
- Etymology: "Dark" from Old English "deorc," meaning "lacking light," "cloud" from Old English "clud," meaning "mass of rock," and "cover" from Old French "covrir," meaning "to cover or hide." This term represents a pattern where the price movement is overtaken by sellers, signaling a potential downturn.
- Similar: Bearish reversal pattern
- Opposite: Piercing line
- Example: "The dark cloud cover pattern indicated that the recent uptrend might be reversing."
- Descending Broadening Wedge(Noun)
- /dih-SEND-ing BRAWD-uhn-ing wehj/
- Definition: A chart pattern that forms as the price action widens while sloping downward, indicating increasing volatility and often leading to a bullish reversal when it occurs in a downtrend.
- Etymology: "Descending" from Latin "descendere," meaning "to go down," "broadening" from Old English "brædan," meaning "to make broad," and "wedge" from Old English "wecg," meaning "a piece of wood or metal used to split." This term describes a pattern that may signal a reversal to an uptrend.
- Similar: Falling broadening wedge
- Opposite: Ascending broadening wedge
- Example: "The descending broadening wedge on the chart suggested a potential reversal to the upside after a period of increasing volatility."
- Descending Channel(Noun)
- /dih-SEND-ing CHAN-ul/
- Definition: A bearish chart pattern where the price moves between two parallel downward-sloping trend lines, indicating a downtrend with lower highs and lower lows.
- Etymology: "Descending" from Latin "descendere," meaning "to go down," and "channel" from Old French "chanel," meaning "a canal or groove." This term describes a sustained downward price movement within parallel trend lines.
- Similar: Falling channel
- Opposite: Ascending channel
- Example: "The descending channel indicated a persistent downtrend, with opportunities to sell at the upper trend line."
- Descending Triangle(Noun)
- /dih-SEND-ing TRY-ang-gul/
- Definition: A bearish chart pattern characterized by a horizontal support line and a descending trend line connecting lower highs, indicating a potential breakdown below support.
- Etymology: "Descending" from Latin "descendere," meaning "to go down," and "triangle" from Greek "triangulum," meaning "three angles." This term describes a pattern where selling pressure increases, often leading to a bearish breakout.
- Similar: Bearish triangle
- Opposite: Ascending triangle
- Example: "The descending triangle suggested that the stock might break below support and continue its downward trend."
- Descending Triangle Breakout(Noun)
- /dih-SEND-ing TRY-ang-gul BRAYK-out/
- Definition: The event when the price breaks below the horizontal support line of a descending triangle pattern, confirming a bearish move and potential for further downward momentum.
- Etymology: "Descending" from Latin "descendere," "triangle" from Greek "triangulum," meaning "three angles," and "breakout" from Old English "brecan," meaning "to break." This term describes the downward price movement that confirms a bearish breakout from the descending triangle pattern.
- Similar: Bearish triangle breakdown
- Opposite: Triangle breakout
- Example: "The descending triangle breakout was followed by a sharp decline in the stock's price."
- Diamond Bottom(Noun)
- /DY-uh-muhnd BOT-uhm/
- Definition: A rare bullish reversal pattern that resembles a diamond shape on the chart, indicating a potential trend reversal from a downtrend to an uptrend.
- Etymology: "Diamond" from Old French "diamant," meaning "a precious gemstone," and "bottom" from Old English "botm," meaning "lowest part." This term describes a reversal pattern where the price forms a diamond shape before reversing upward.
- Similar: Diamond reversal
- Opposite: Diamond top
- Example: "The diamond bottom pattern suggested that the stock might be poised for a significant reversal to the upside."
- Diamond Top(Noun)
- /DY-uh-muhnd top/
- Definition: A rare bearish reversal pattern that resembles a diamond shape on the chart, indicating a potential trend reversal from an uptrend to a downtrend.
- Etymology: "Diamond" from Old French "diamant," meaning "a precious gemstone," and "top" from Old English "topp," meaning "highest point." This term describes a reversal pattern where the price forms a diamond shape before reversing downward.
- Similar: Diamond reversal
- Opposite: Diamond bottom
- Example: "The diamond top pattern indicated that the stock might be headed for a significant decline."
- Distribution Pattern(Noun)
- /dis-truh-BYOO-shun PAT-urn/
- Definition: A chart pattern that indicates the gradual selling of a stock by institutional investors, often leading to a consolidation phase before a potential downward price movement.
- Etymology: "Distribution" from Latin "distributio," meaning "a division," and "pattern" from Old French "patron," meaning "model or guide." This term refers to a phase where a stock is being sold by large investors, usually leading to a downward breakout.
- Similar: Distribution phase
- Opposite: Accumulation pattern
- Example: "The distribution pattern suggested that institutional investors were selling their shares, potentially leading to a price decline."
- Dragonfly Doji(Noun)
- /DRAG-un-fly DOH-jee/
- Definition: A candlestick pattern that forms when the open, high, and close are at the same price, with a long lower shadow, indicating potential bullish reversal if it occurs after a downtrend.
- Etymology: "Dragonfly" from Old English "draca," meaning "dragon," and "fly," and "doji" from Japanese, meaning "blunder" or "mistake," referring to the uncertainty represented by the pattern. This term describes a pattern where the price action suggests indecision but with potential for reversal.
- Similar: Bullish reversal doji
- Opposite: Gravestone doji
- Example: "The dragonfly doji at the end of the downtrend signaled a potential reversal to the upside."
- Expanding Triangle(Noun)
- /ik-SPAND-ing TRY-ang-gul/
- Definition: A chart pattern characterized by diverging trend lines, where the price moves in a widening range, often indicating increasing volatility and the potential for a breakout in either direction.
- Etymology: "Expanding" from Latin "expandere," meaning "to spread out," and "triangle" from Greek "triangulum," meaning "three angles." This term describes a pattern where the price range broadens over time, suggesting increased market uncertainty.
- Similar: Broadening triangle
- Opposite: Contracting triangle
- Example: "The expanding triangle pattern indicated that the market was becoming more volatile, with a breakout likely."
- Failed Breakdown(Noun)
- /fayld BRAYK-down/
- Definition: A situation where the price temporarily breaks below a support level but then quickly reverses and moves back above it, invalidating the bearish signal.
- Etymology: "Failed" from Old English "falan," meaning "to fall short," and "breakdown" from Old English "brecan," meaning "to break." This term refers to an instance where a bearish signal does not result in a sustained downward movement.
- Similar: False breakdown
- Opposite: Successful breakdown
- Example: "The failed breakdown below support led to a strong rally as buyers stepped in."
- Failed Breakout(Noun)
- /fayld BRAYK-out/
- Definition: A situation where the price temporarily breaks above a resistance level but then quickly reverses and falls back below it, invalidating the bullish signal.
- Etymology: "Failed" from Old English "falan," meaning "to fall short," and "breakout" from Old English "brecan," meaning "to break." This term refers to an instance where a bullish signal does not result in a sustained upward movement.
- Similar: False breakout
- Opposite: Successful breakout
- Example: "The failed breakout above resistance triggered a sharp sell-off as traders rushed to close long positions."
- Falling Wedge(Noun)
- /FAW-ling wehj/
- Definition: A bullish reversal pattern that forms as the price action narrows while sloping downward, often signaling a potential reversal to an uptrend.
- Etymology: "Falling" from Old English "feallan," meaning "to fall," and "wedge" from Old English "wecg," meaning "a piece of wood or metal used to split." This term describes a pattern where prices are falling within a narrowing range, often leading to an upward reversal.
- Similar: Bullish wedge
- Opposite: Rising wedge
- Example: "The falling wedge pattern suggested that the stock might reverse course and begin to trend upward."
- Flag(Noun)
- /flag/
- Definition: A continuation pattern that forms after a sharp price movement, characterized by a brief consolidation in a parallel, sloping channel before the price continues in the original direction.
- Etymology: "Flag" from Old English "flagge," meaning "banner or ensign." This term describes a short consolidation phase within a strong trend, resembling a flag on a pole.
- Similar: Continuation flag
- Example: "The flag pattern indicated that the recent strong price movement might continue after a brief pause."
- Flagpole(Noun)
- /FLAG-pohl/
- Definition: The sharp price movement that precedes the flag pattern, representing the strong momentum that leads to the consolidation phase.
- Etymology: "Flagpole" from Old English "flagge," meaning "banner," and "pole" from Old English "pal," meaning "stake." This term refers to the initial strong movement that sets up the flag pattern.
- Similar: Preceding rally
- Example: "The long flagpole preceding the flag pattern indicated strong bullish momentum."
- Gap Down(Noun)
- /gap down/
- Definition: A chart pattern where the price of a stock opens significantly lower than its previous close, leaving a gap on the chart, often indicating strong selling pressure.
- Etymology: "Gap" from Old Norse "gap," meaning "an opening," and "down" from Old English "dun," meaning "hill." This term refers to a sharp decline at the market open, creating a visible gap on the chart.
- Similar: Downward gap
- Opposite: Gap up
- Example: "The gap down at the open signaled that investors were selling off the stock aggressively."
- Gap Up(Noun)
- /gap up/
- Definition: A chart pattern where the price of a stock opens significantly higher than its previous close, leaving a gap on the chart, often indicating strong buying pressure.
- Etymology: "Gap" from Old Norse "gap," meaning "an opening," and "up" from Old English "upp," meaning "upward." This term refers to a sharp increase at the market open, creating a visible gap on the chart.
- Similar: Upward gap
- Opposite: Gap down
- Example: "The gap up at the open suggested strong buying interest and positive news for the stock."
- Gravestone Doji(Noun)
- /GRAYV-stohn DOH-jee/
- Definition: A bearish reversal candlestick pattern where the open, close, and low are at the same price, with a long upper shadow, indicating that buyers were unable to sustain the higher prices.
- Etymology: "Gravestone" from Old English "grafstān," meaning "a stone marking a grave," and "doji" from Japanese, meaning "blunder" or "mistake." This term describes a pattern suggesting that a bullish attempt was met with strong selling, leading to a potential reversal.
- Similar: Bearish doji
- Opposite: Dragonfly doji
- Example: "The gravestone doji at the top of the uptrend signaled a possible reversal to the downside."
- Inverse Head and Shoulders(Noun)
- /in-VURS hed and SHOHL-durz/
- Definition: A bullish reversal pattern that resembles an upside-down head and shoulders, indicating a potential reversal from a downtrend to an uptrend.
- Etymology: "Inverse" from Latin "inversus," meaning "turned upside down," and "head and shoulders" from the pattern resembling the human anatomy. This term describes a pattern where a downtrend may reverse after the completion of the formation.
- Similar: Inverted head and shoulders
- Opposite: Head and shoulders
- Example: "The inverse head and shoulders pattern suggested that the stock might be poised for a bullish reversal."
- Island Reversal(Noun)
- /EYE-luhnd ri-VUR-sul/
- Definition: A reversal pattern where a small group of price bars is separated from the preceding and following price action by gaps, indicating a sharp reversal in trend direction.
- Etymology: "Island" from Old English "īegland," meaning "land surrounded by water," and "reversal" from Latin "reversare," meaning "to turn back." This term describes a pattern where a brief isolated price action indicates a strong reversal.
- Similar: Island top/bottom
- Opposite: Continuation pattern
- Example: "The island reversal signaled a sharp change in market sentiment, leading to a significant price move."
- Marubozu(Noun)
- /mah-roo-BOH-zoo/
- Definition: A candlestick with no shadows, where the open and close are at the high and low of the period, indicating strong buying (bullish) or selling (bearish) pressure.
- Etymology: "Marubozu" from Japanese, meaning "bald" or "shaven," referring to the absence of shadows on the candlestick. This term represents decisive price action in either direction.
- Similar: Full-bodied candlestick
- Opposite: Doji
- Example: "The bullish marubozu indicated strong buying interest, with no pullback during the trading session."
- Measured Move(Noun)
- /MEZH-urd moov/
- Definition: A continuation pattern that projects the next price movement based on the size of the previous movement, often used to estimate the target price after a breakout.
- Etymology: "Measured" from Old English "measur," meaning "to estimate," and "move" from Old French "movoir," meaning "to move." This term describes a method for projecting the potential size of a price move based on previous action.
- Similar: Projected move
- Opposite: Unpredictable move
- Example: "Traders use the measured move to set price targets after a breakout from a consolidation pattern."
- Megaphone Pattern(Noun)
- /MEG-uh-fohn PAT-urn/
- Definition: A chart pattern characterized by increasing volatility, with price swings becoming wider, creating a shape that resembles a megaphone, often indicating market indecision and potential reversal.
- Etymology: "Megaphone" from Greek "mega," meaning "large," and "phone," meaning "voice," describing the expanding shape of the pattern. This term refers to a pattern with increasing highs and lows, signaling volatility.
- Similar: Broadening formation
- Opposite: Contracting pattern
- Example: "The megaphone pattern suggested that the market was becoming increasingly volatile and uncertain."
- Parabolic Curve(Noun)
- /par-uh-BOL-ik kurv/
- Definition: A steep and accelerating price movement that forms a curve resembling a parabola, often leading to a sharp reversal once the trend exhausts itself.
- Etymology: "Parabolic" from Greek "parabole," meaning "comparison," and "curve" from Latin "curvus," meaning "bent." This term describes a rapid price increase that may be unsustainable.
- Similar: Exponential curve
- Opposite: Linear trend
- Example: "The stock's parabolic curve indicated a buying frenzy, but investors should be cautious of a potential sharp reversal."
- Pennant(Noun)
- /PEN-uhnt/
- Definition: A continuation pattern that forms after a strong price movement, characterized by a small symmetrical triangle that consolidates before the price continues in the original direction.
- Etymology: "Pennant" from Old French "penon," meaning "flag or banner." This term describes a short-term consolidation that typically results in the continuation of the prior trend.
- Similar: Continuation triangle
- Opposite: Reversal pattern
- Example: "The pennant pattern suggested that the stock might continue its upward trend after a brief consolidation."
- Piercing Line(Noun)
- /PEER-sing lahyn/
- Definition: A bullish candlestick reversal pattern where a bearish candle is followed by a bullish candle that opens lower but closes above the midpoint of the previous candle, indicating a potential reversal.
- Etymology: "Piercing" from Old French "percer," meaning "to pierce," and "line" from Latin "linea," meaning "string or thread." This term refers to a reversal pattern where buyers regain control after a downtrend.
- Similar: Bullish reversal pattern
- Opposite: Dark cloud cover
- Example: "The piercing line pattern indicated that the recent selling pressure might be reversing, with buyers stepping in."
- Pipe Bottom(Noun)
- /pahyp BOT-uhm/
- Definition: A bullish reversal pattern that forms at the end of a downtrend, characterized by two long bearish and bullish candles that have similar open and close prices, indicating a potential reversal.
- Etymology: "Pipe" from Old English "pipe," meaning "tube," and "bottom" from Old English "botm," meaning "lowest part." This term describes a pattern resembling parallel pipes, indicating a reversal from a downtrend.
- Similar: Double bottom
- Opposite: Pipe top
- Example: "The pipe bottom pattern suggested that the stock might be poised for a bullish reversal."
- Pipe Top(Noun)
- /pahyp top/
- Definition: A bearish reversal pattern that forms at the end of an uptrend, characterized by two long bullish and bearish candles that have similar open and close prices, indicating a potential reversal.
- Etymology: "Pipe" from Old English "pipe," meaning "tube," and "top" from Old English "topp," meaning "highest point." This term describes a pattern resembling parallel pipes, indicating a reversal from an uptrend.
- Similar: Double top
- Opposite: Pipe bottom
- Example: "The pipe top pattern signaled that the stock might be headed for a bearish reversal."
- Price Channel(Noun)
- /prahys CHAN-ul/
- Definition: A chart pattern where the price moves between two parallel trend lines, either upward (ascending channel) or downward (descending channel), indicating a sustained trend within the channel boundaries.
- Etymology: "Price" from Old French "pris," meaning "value," and "channel" from Old French "chanel," meaning "a canal or groove." This term describes a range-bound price movement within parallel trend lines.
- Similar: Trading channel
- Example: "The stock traded within a well-defined price channel, offering opportunities to buy at the lower trend line and sell at the upper trend line."
- Rectangle(Noun)
- /REK-tang-gul/
- Definition: A chart pattern that forms when the price moves between two horizontal support and resistance levels, indicating a period of consolidation before a breakout in either direction.
- Etymology: "Rectangle" from Latin "rectangulus," meaning "right angle." This term refers to a sideways price movement between support and resistance levels, forming a rectangular shape.
- Similar: Trading range
- Example: "The rectangle pattern suggested that the stock was consolidating, with a potential breakout likely."
- Resistance Level(Noun)
- /ri-ZIS-tuhns LEV-ul/
- Definition: A price level at which a stock or market repeatedly fails to rise above, often due to an abundance of selling interest at that level.
- Etymology: "Resistance" from Old French "resistance," meaning "opposition," and "level" from Old French "level," meaning "a horizontal line." This term describes a price point where upward movement is repeatedly halted by selling pressure.
- Similar: Ceiling
- Opposite: Support level
- Example: "The stock struggled to break through the $100 resistance level, indicating strong selling pressure."
- Rising Wedge(Noun)
- /RYZ-ing wehj/
- Definition: A bearish reversal pattern that forms as the price action narrows while sloping upward, often signaling a potential reversal to a downtrend.
- Etymology: "Rising" from Old English "risan," meaning "to move upward," and "wedge" from Old English "wecg," meaning "a piece of wood or metal used to split." This term describes a pattern where prices are rising within a narrowing range, often leading to a downward reversal.
- Similar: Bearish wedge
- Opposite: Falling wedge
- Example: "The rising wedge pattern suggested that the stock might reverse course and begin to trend downward."
- Rounded Bottom(Noun)
- /ROWN-ded BOT-uhm/
- Definition: A bullish reversal pattern that forms at the end of a downtrend, where the price gradually makes a rounded shape before starting an upward trend.
- Etymology: "Rounded" from Old French "ronder," meaning "to make round," and "bottom" from Old English "botm," meaning "lowest part." This term describes a gradual, rounded price formation that signals a potential reversal to the upside.
- Similar: Saucer bottom
- Opposite: Rounded top
- Example: "The rounded bottom pattern suggested that the stock was transitioning from a downtrend to an uptrend."
- Rounded Top(Noun)
- /ROWN-ded top/
- Definition: A bearish reversal pattern that forms at the end of an uptrend, where the price gradually makes a rounded shape before starting a downward trend.
- Etymology: "Rounded" from Old French "ronder," meaning "to make round," and "top" from Old English "topp," meaning "highest point." This term describes a gradual, rounded price formation that signals a potential reversal to the downside.
- Similar: Saucer top
- Opposite: Rounded bottom
- Example: "The rounded top pattern indicated that the stock might be entering a downtrend after a prolonged uptrend."
- Rounded Top Reversal(Noun)
- /ROWN-ded top ri-VUR-sul/
- Definition: A bearish reversal pattern that occurs after an uptrend, characterized by a rounded top formation followed by a breakdown, indicating a shift from bullish to bearish sentiment.
- Etymology: "Rounded" from Old French "ronder," meaning "to make round," "top" from Old English "topp," meaning "highest point," and "reversal" from Latin "reversare," meaning "to turn back." This term describes a reversal pattern where a rounded top leads to a downward trend.
- Similar: Saucer top reversal
- Opposite: Rounded bottom reversal
- Example: "The rounded top reversal signaled a change in trend, with the stock likely to move lower."
- Rounding Bottom(Noun)
- /: ROW-nding BOT-uhm/
- Definition: A bullish reversal pattern that forms at the end of a downtrend, characterized by a gradual, rounded price formation before the trend reverses upward.
- Etymology: "Rounding" from Old French "ronder," meaning "to make round," and "bottom" from Old English "botm," meaning "lowest part." This term describes a pattern that signals a transition from a downtrend to an uptrend.
- Similar: Saucer bottom
- Opposite: Rounding top
- Example: "The rounding bottom pattern suggested that the stock might be entering a new uptrend after a prolonged decline."
- Running Triangle(Noun)
- /RUN-ning TRY-ang-gul/
- Definition: A continuation pattern where the price forms a triangle that slants in the direction of the existing trend, indicating that the trend is likely to continue after the pattern completes.
- Etymology: "Running" from Old English "rinnan," meaning "to flow," and "triangle" from Greek "triangulum," meaning "three angles." This term describes a slanted triangle pattern that suggests the continuation of the existing trend.
- Similar: Slanted triangle
- Opposite: Symmetrical triangle
- Example: "The running triangle pattern indicated that the current uptrend was likely to continue once the consolidation ended."
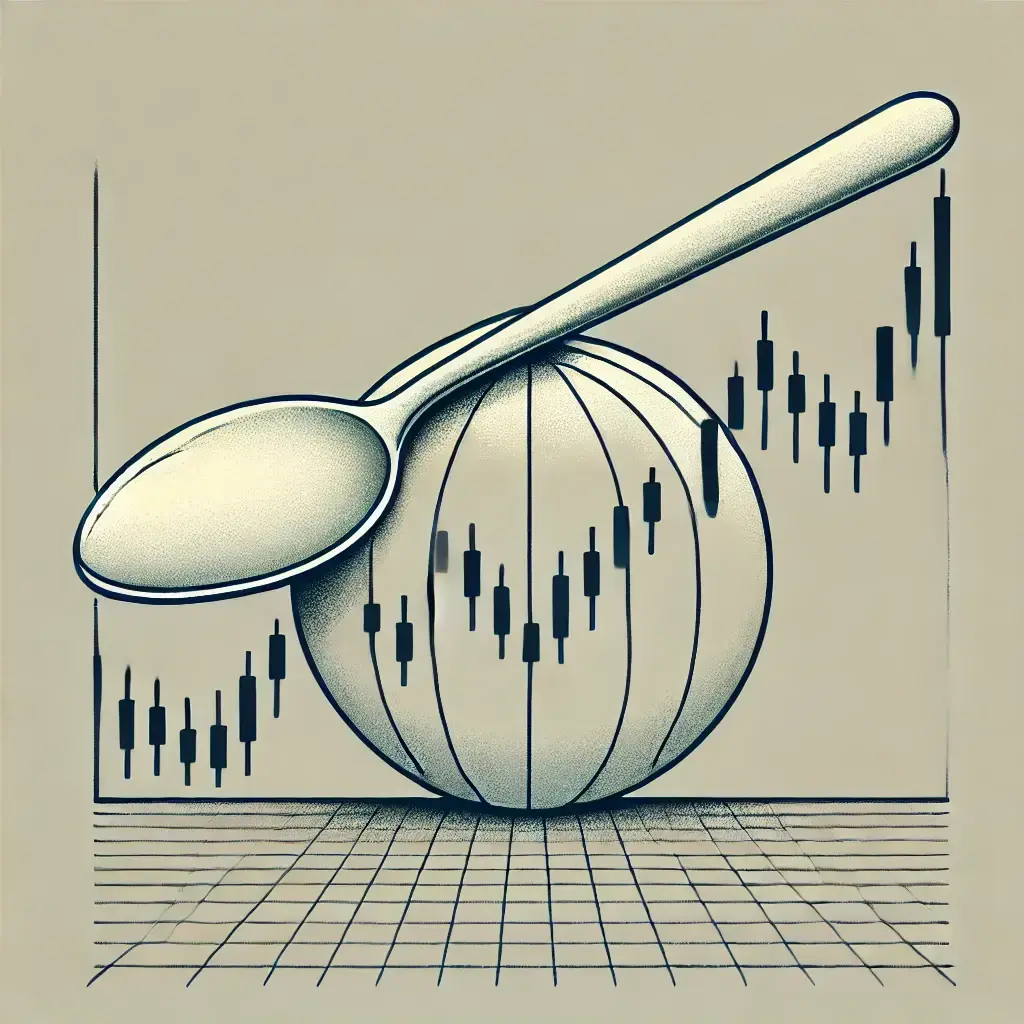
- Saucer Pattern(Noun)
- /SAW-ser PAT-urn/
- Definition: A chart pattern that resembles a saucer shape, indicating a gradual reversal from a downtrend to an uptrend, often seen as a bullish signal.
- Etymology: "Saucer" from Old French "saussier," meaning "a small dish," and "pattern" from Old French "patron," meaning "model or guide." This term describes a pattern that suggests a gradual bottoming out before a trend reversal.
- Similar: Saucer bottom
- Opposite: Saucer top
- Example: "The saucer pattern suggested that the stock was bottoming out and might soon start an uptrend."
- Spinning Top(Noun)
- /SPIN-ing top/
- Definition: A candlestick pattern with a small body and long shadows, indicating indecision in the market as the price moves significantly but closes near its open.
- Etymology: "Spinning" from Old English "spinnan," meaning "to spin," and "top" from Old English "topp," meaning "highest point." This term describes a candlestick that suggests uncertainty or indecision among traders.
- Similar: Indecision candlestick
- Opposite: Marubozu
- Example: "The spinning top pattern indicated that neither buyers nor sellers had control, signaling potential market indecision."
- Support Level(Noun)
- /suh-PORT LEV-ul/
- Definition: A price level at which a stock or market repeatedly fails to fall below, often due to an abundance of buying interest at that level.
- Etymology: "Support" from Old French "supporter," meaning "to bear or carry," and "level" from Old French "level," meaning "a horizontal line." This term describes a price point where downward movement is repeatedly halted by buying pressure.
- Similar: Floor
- Opposite: Resistance level
- Example: "The stock found support at the $50 level, where buyers consistently stepped in to prevent further declines."
- Swing High/Swing Low(Noun)
- /swing HAHY/swing loh/
- Definition: Points on a price chart where the market changes direction, with swing highs being peaks and swing lows being troughs, often used to identify trends and reversals.
- Etymology: "Swing" from Old English "swingan," meaning "to move back and forth," "high" from Old English "heah," meaning "of great height," and "low" from Old Norse "lagr," meaning "not high." This term refers to key points that define the range of price movements.
- Similar: Peaks and troughs
- Example: "Traders look for swing highs and swing lows to identify potential entry and exit points."
- Symmetrical Flag(Noun)
- /si-MET-rih-kuhl flag/
- Definition: A continuation pattern where the price forms a symmetrical triangle within a flag pattern, indicating that the trend is likely to continue after the pattern completes.
- Etymology: "Symmetrical" from Greek "symmetros," meaning "having proportion," and "flag" from Old English "flagge," meaning "banner or ensign." This term describes a balanced flag pattern that suggests the continuation of the existing trend.
- Similar: Symmetrical triangle
- Opposite: Asymmetrical flag
- Example: "The symmetrical flag pattern indicated that the stock might continue its uptrend after a brief consolidation."
- Symmetrical Pattern(Noun)
- /si-MET-rih-kuhl PAT-urn/
- Definition: A chart pattern where the price moves within two converging trend lines that are symmetrical, indicating that the price could break out in either direction.
- Etymology: "Symmetrical" from Greek "symmetros," meaning "having proportion," and "pattern" from Old French "patron," meaning "model or guide." This term describes a pattern with equal slopes on both sides, signaling potential for a breakout in either direction.
- Similar: Symmetrical triangle
- Opposite: Asymmetrical pattern
- Example: "The symmetrical pattern suggested that traders should watch for a breakout in either direction."
- Symmetrical Triangle(Noun)
- /si-MET-rih-kuhl TRY-ang-gul/
- Definition: A continuation pattern where the price forms a symmetrical triangle, indicating that the trend is likely to continue after the pattern completes.
- Etymology: "Symmetrical" from Greek "symmetros," meaning "having proportion," and "triangle" from Greek "triangulum," meaning "three angles." This term describes a balanced triangle pattern that suggests the continuation of the existing trend.
- Similar: Symmetrical pattern
- Opposite: Asymmetrical triangle
- Example: "The symmetrical triangle pattern indicated that the stock might continue its uptrend after a brief consolidation."
- Trend Continuation(Noun)
- /trend kon-tin-YOO-ay-shun/
- Definition: A market condition where the existing trend persists, often signaled by continuation patterns such as flags, pennants, and triangles.
- Etymology: "Trend" from Old English "trendan," meaning "to revolve or turn," and "continuation" from Latin "continuare," meaning "to join together." This term describes the ongoing movement in the same direction as the current trend.
- Similar: Trend persistence
- Opposite: Trend reversal
- Example: "Traders look for signals of trend continuation to confirm that the market will keep moving in the same direction."
- Trend Line Break(Noun)
- /trend lahyn brayk/
- Definition: The event when the price moves through a previously established trend line, indicating a potential change in the trend's direction.
- Etymology: "Trend" from Old English "trendan," meaning "to revolve or turn," "line" from Latin "linea," meaning "string or thread," and "break" from Old English "brecan," meaning "to break." This term describes a significant event where the price breaks through a key trend line, often signaling a trend reversal or acceleration.
- Similar: Trendline breach
- Opposite: Trend line hold
- Example: "The trend line break suggested that the stock might reverse its current trend and start moving in the opposite direction."
- Triangle Breakdown(Noun)
- /TRY-ang-gul BRAYK-down/
- Definition: The event when the price breaks below the lower trend line of a triangle pattern, confirming a bearish move and potential for further downward momentum.
- Etymology: "Triangle" from Greek "triangulum," meaning "three angles," and "breakdown" from Old English "brecan," meaning "to break." This term describes the downward price movement that confirms a bearish breakout from a triangle pattern.
- Similar: Bearish triangle breakout
- Opposite: Triangle breakout
- Example: "The triangle breakdown was followed by a sharp decline in the stock's price."
- Triangle Breakout(Noun)
- /TRY-ang-gul BRAYK-out/
- Definition: The event when the price breaks above the upper trend line of a triangle pattern, confirming a bullish move and potential for further upward momentum.
- Etymology: "Triangle" from Greek "triangulum," meaning "three angles," and "breakout" from Old English "brecan," meaning "to break." This term describes the upward price movement that confirms a bullish breakout from a triangle pattern.
- Similar: Bullish triangle breakout
- Opposite: Triangle breakdown
- Example: "The triangle breakout suggested that the stock might continue its upward trend after breaking above resistance."
- Triple Bottom(Noun)
- /TRIP-ul BOT-uhm/
- Definition: A bullish reversal pattern that forms after a downtrend, characterized by three distinct lows at approximately the same level, indicating strong support and a potential upward reversal.
- Etymology: "Triple" from Latin "triplus," meaning "threefold," and "bottom" from Old English "botm," meaning "lowest part." This term describes a pattern where the price tests the same support level three times before reversing upward.
- Similar: Triple low
- Opposite: Triple top
- Example: "The triple bottom pattern suggested that the stock had found strong support and might soon reverse to the upside."
- Triple Top(Noun)
- /TRIP-ul top/
- Definition: A bearish reversal pattern that forms after an uptrend, characterized by three distinct highs at approximately the same level, indicating strong resistance and a potential downward reversal.
- Etymology: "Triple" from Latin "triplus," meaning "threefold," and "top" from Old English "topp," meaning "highest point." This term describes a pattern where the price tests the same resistance level three times before reversing downward.
- Similar: Triple high
- Opposite: Triple bottom
- Example: "The triple top pattern indicated that the stock was facing strong resistance and might reverse to the downside."
- Tweezer Bottom(Noun)
- /TWEE-zur BOT-uhm/
- Definition: A bullish reversal candlestick pattern characterized by two consecutive candles with similar lows, indicating strong support at a particular level.
- Etymology: "Tweezer" from Middle English "twees," meaning "two," and "bottom" from Old English "botm," meaning "lowest part." This term describes a pattern where two candles share a common low, signaling a potential reversal.
- Similar: Double bottom
- Opposite: Tweezer top
- Example: "The tweezer bottom pattern suggested that the stock might be poised for a bullish reversal."
- Tweezer Top(Noun)
- /TWEE-zur top/
- Definition: A bearish reversal candlestick pattern characterized by two consecutive candles with similar highs, indicating strong resistance at a particular level.
- Etymology: "Tweezer" from Middle English "twees," meaning "two," and "top" from Old English "topp," meaning "highest point." This term describes a pattern where two candles share a common high, signaling a potential reversal.
- Similar: Double top
- Opposite: Tweezer bottom
- Example: "The tweezer top pattern indicated that the stock might be facing strong resistance and could reverse downward."
- Volatility Pattern(Noun)
- /vol-uh-TIL-i-tee PAT-urn/
- Definition: A chart pattern that indicates increasing or decreasing volatility in a stock's price, often preceding significant price movements or trend reversals.
- Etymology: "Volatility" from Latin "volatilis," meaning "fleeting," and "pattern" from Old French "patron," meaning "model or guide." This term describes patterns that signal changes in the magnitude of price fluctuations.
- Similar: Volatility signal
- Opposite: Stability pattern
- Example: "The volatility pattern indicated that the stock might be preparing for a significant price movement."
- Wedge(Noun)
- /wehj/
- Definition: A chart pattern where the price converges between two trend lines, indicating a potential reversal or continuation depending on the direction of the breakout.
- Etymology: "Wedge" from Old English "wecg," meaning "a piece of wood or metal used to split." This term refers to a narrowing price range that often leads to a breakout.
- Similar: Converging triangle
- Opposite: Expanding triangle
- Example: "The wedge pattern suggested that the stock might soon break out, with the direction of the move indicating the future trend."