I. Introduction
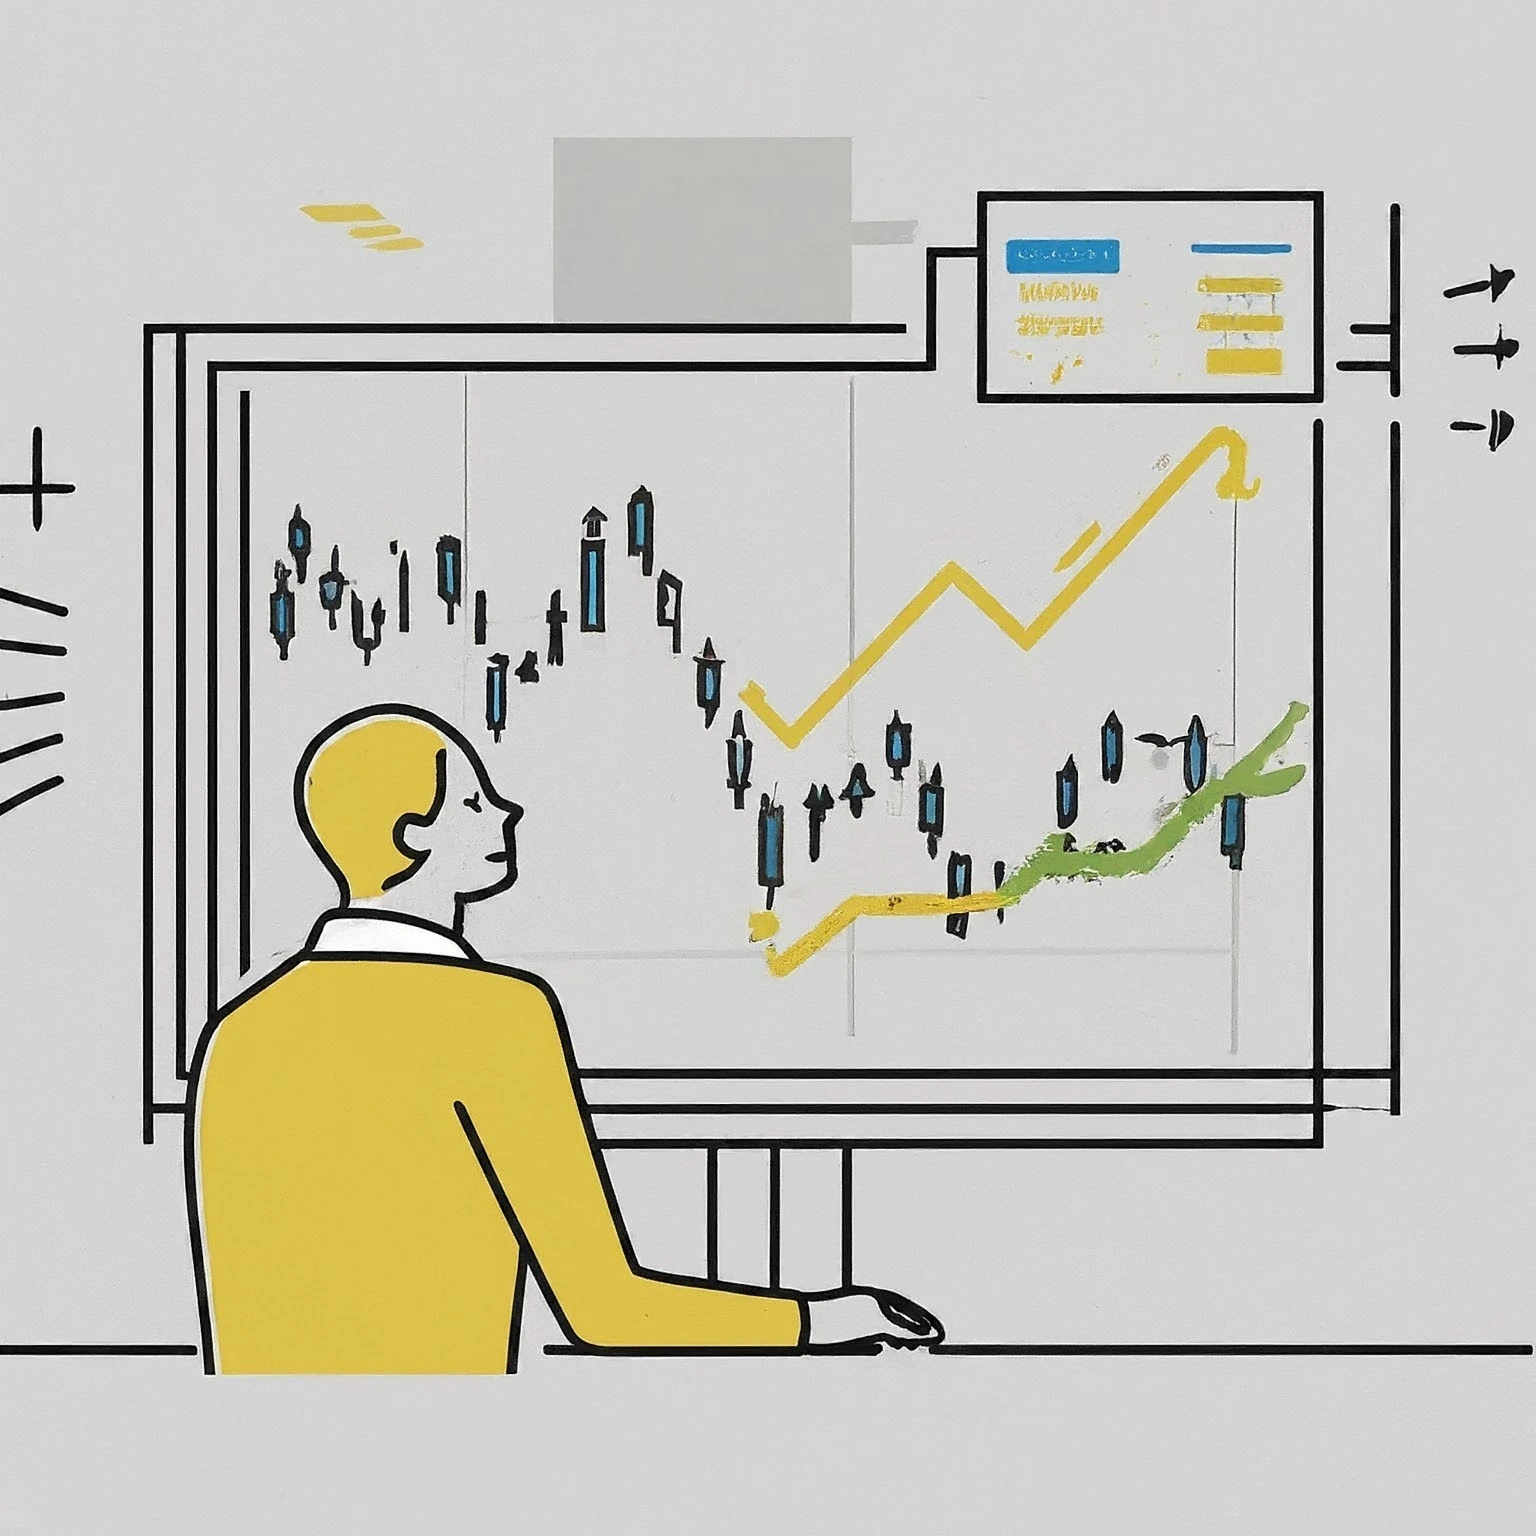
As a technical trader, you understand that mastering the unpredictable financial markets depends on your skill in recognizing chart patterns clearly. In trading, experienced professionals often share moments where one chart pattern has caused a sudden change in their strategies—reflecting market sentiment and becoming useful information. These patterns are more than just images; they reflect market feelings, turning the actions of traders into signs of possible price shifts. By carefully reviewing past data, you turn these patterns into effective tools, helping you find the best times to enter and exit trades.
For those unfamiliar with this topic, grasping the basics is essential; you might want to check out How to Read Stock Charts: A Beginner’s Guide to strengthen your skills in chart reading. A significant historical insight shows how crucial this basic knowledge is. The beginnings of candlestick charting can be traced to the 17th century, when Japanese rice traders pioneered the technique, highlighting the lasting value of chart analysis in trading (Nison, 1991, p. 5). Think of the trader who diligently analyzes chart shapes and transforms a small portfolio into a successful venture; their achievement exemplifies the importance of recognizing patterns.
II. Literature Review
A. Historical Context
Chart patterns have a long history, going back to the 17th century when Japanese rice traders developed candlestick charting. This essential knowledge built the foundation for modern technical analysis and was shaped by early figures like Charles Dow. The development of chart patterns can be compared to the construction of a skyscraper; each insight builds on the previous one, reaching the heights of modern technical analysis. Experts, like John Murphy and Thomas Bulkowski, have broadened the discussion, offering insights into how particular chart patterns can reliably predict market behavior, always considering context. Murphy highlights the significant role of identifying these chart patterns in pinpointing market trends, helping traders make smart choices about entry and exit points (Murphy, 1999, p. 120). For additional context, it’s useful to review The History of the Stock Market: Key Milestones to understand how charting methods have progressed through time.
B. Previous Research Findings
A lot of research has examined how reliable chart patterns are under different market situations. For example, detailed studies by John Murphy show that formations like Head and Shoulders or Double Tops can be accurate markers of price movement. However, it’s important to recognize that these signals depend on context; as Pring noted, chart patterns like Head and Shoulders and Double Tops signal trends but their predictive ability can change based on market conditions (Pring, 2002, p. 154). Market analysts often point out that even the strongest patterns can mislead traders when contextual signals are ignored. Insights from behavioral economics indicate that biases can alter interpretations, stressing the need for a disciplined method in the volatile market. To enhance this understanding, you might find valuable insights in Understanding Market Sentiment: Fear vs. Greed, which examines the psychology behind trading choices.
C. Current Trends in Chart Pattern Analysis
With the growth of algorithmic trading and machine learning, chart pattern analysis is quickly changing. Traders who previously relied only on manual methods talk about how automated systems have changed their decision-making habits. In this context, algorithmic trading functions like a high-speed train, speeding ahead of traditional methods and reshaping the trading world entirely. These changes require a reassessment of old techniques to keep a competitive edge in these fast-moving markets. Chan points out that algorithmic trading and machine learning have transformed how traders analyze chart patterns, creating a need for modern strategies that align with these advancements (Chan, 2017, p. 39). For a deeper understanding of this evolution, consider reading about The Role of Algorithms in the Stock Market.
III. Methodology
A. Research Design
This study uses a mixed-methods approach, combining qualitative insights from literature with quantitative data based on past price movements. Many researchers have highlighted the clear benefits of combining qualitative and quantitative analysis to capture the full range of market behavior. This broad framework allows for a thorough investigation of chart patterns from both theoretical and practical viewpoints.
B. Data Collection
To enrich our study, we will gather data from various sources, including industry reports, market analytics services, and academic articles. Collecting data is crucial for research; it fuels the analysis, helping traders draw informed conclusions. This diverse collection of data enhances our grasp of how chart patterns operate across different market conditions, emphasizing the need for context in trading choices. With various sources, traders often discover insights that serve as valuable additions to their strategic toolkits. Additionally, understanding The Role of Financial Statements in Stock Analysis can support your pattern analyses with numerical evidence.
C. Analytical Techniques
Using advanced pattern recognition tools along with reliable trading software will improve our visual analysis. Traders have long realized that backtesting historical patterns often reveals trends hidden beneath the noise of real-time markets. Furthermore, backtesting will support our findings, ensuring a solid evaluation of how effective chart patterns are in practical trading situations.
IV. Analysis
A. Types of Chart Patterns
Like a skilled trader, one must sense the currents of market behavior, interpreting continuation patterns as cues to act. Patterns such as flags and pennants suggest that the current trend will likely continue after a brief pause. Recognizing these shapes allows you to exploit ongoing momentum and capitalize on strong trends for possible gains. A trader who adeptly identifies reversal patterns is similar to a chess player anticipating their rival's next move to secure a strategic advantage. Reversal patterns—including Head and Shoulders and Double Tops/Bottoms—signal potential shifts in market direction. Quickly detecting these shapes helps you adjust your strategy promptly, enhancing your chances of success in a changing trading environment. For a thorough look at reliable patterns, check out The Top 10 Most Reliable Chart Patterns in Trading.
B. Understanding Market Trends
Understanding market trends—bullish, bearish, or sideways—is vital for putting your chart patterns into context. Effectively determining which patterns link up with specific trends lays the groundwork for smart trading strategies, allowing you to adjust your positions as market dynamics change. Successful traders often express that grasping market trends is like sensing the economy's pulse, guiding their strategies. To dive deeper into what these trends mean, you may want to read Understanding Bull and Bear Markets: What They Mean for Investors.
C. Integration with Other Technical Indicators
Just like a composer combines harmonies, traders should mix different indicators for a thorough analysis of market trends. Enhancing your analysis with additional tools such as moving averages or the Relative Strength Index (RSI) can provide deeper insights into chart patterns. This multi-dimensional method boosts signal reliability, significantly reducing risks associated with misleading indicators.
D. Psychological Factors and Market Behavior
Understanding the psychological aspects of trading—where emotions like fear and greed can influence price movements—is crucial. Experts argue that emotional volatility in trading is like a double-edged sword, capable of impacting both profits and confidence. Being aware of these influences enables you to make more logical choices and strengthens your ability to interpret chart patterns correctly. Awareness of psychological factors provides stability, preventing traders from being carried away by the flows of market sentiment. To improve your trading mindset, looking into Understanding Trading Psychology: A Beginner’s Guide can be quite helpful.
E. Limitations and Challenges
While chart patterns can be effective tools, their accuracy often relies on personal interpretation. False signals and market noise can pose challenges, highlighting the need for careful risk management in your overall trading plan. Traders often recount occasions when market noise complicated their judgments, leading them to reassess their strategies.
V. Practical Applications
A. Chart Patterns in Trading Strategies
Using chart patterns is like filling a toolbox—the right tools can strengthen your defenses against market risks. Incorporating chart patterns into your approach can bring significant gains. Whether engaging in day trading or focusing on long-term holdings, effectively spotting these patterns can improve your market interactions and success rate. Traders frequently share stories about how recognizing patterns changed their methods for picking trades.
B. Risk Management Techniques
Strong risk management is key to your trading achievements. Many trading mentors stress that solid risk management methods act as essential protection during volatile markets. By setting stop-loss and take-profit levels based on chart analysis, you safeguard your funds. Thorough evaluations of market conditions before trading ensure your choices are well-informed and strategic. To explore this critical topic further, consider The Importance of Risk Management in Technical Trading.
C. Tools and Resources for Traders
Think of reliable trading platforms as your personal command center, providing you with the information needed to make smart decisions. Utilize robust trading platforms like TradingView and Thinkorswim. These platforms offer extensive charting features and educational materials, essential for sharpening your pattern recognition and helping you grow throughout your trading journey. Traders often find that a well-designed interface not only improves their efficiency but also enhances their overall trading skills.
VI. Critical Analysis and Discussion
A. Effectiveness of Chart Patterns
Research shows that while some chart patterns can be trustworthy indicators, context is crucial—especially in unstable market situations where caution can avoid costly mistakes. Many traders experience the market's volatility, emphasizing that flexibility is a key element of trading success.
B. Integration of Fundamental Analysis
Combining technical and fundamental analysis works like merging light and shadow, offering a clearer view of market dynamics. Smart traders recognize that integrating technical and fundamental analysis creates a complete picture of market movements. This composition deepens your understanding of price changes and strengthens your trading strategies. Many successful investors speak to the advantages gained from merging these approaches, showing a greater understanding of market shifts. For those wanting to expand their methodology comprehension, check out How to Use Fundamental Analysis to Pick Stocks as a useful resource.
C. Future Directions
With the rise of artificial intelligence and machine learning in trading, opportunities for refining chart pattern analysis are expanding. Traders are increasingly eager to try AI-enhanced tools, sharing how these innovations have improved their trading abilities. Embracing these advances can sharpen your trend identification skills and enhance your forecasts, revolutionizing your trading advantages even further. For looking ahead, consider reading about The Future of Growth Investing: Trends to Watch.
VII. Conclusion
A. Summary of Key Findings
This study has revealed the complex influence that chart patterns hold within trading strategies. Your commitment to ongoing education and adaptability is vital for achieving long-term success in a constantly changing market.
B. Recommendations for Traders
Engaging in continuous learning and participating in trading communities can serve as a guiding light, assisting beginners through uncertain times. Maintain disciplined practices based on your chart pattern analysis while staying aware of their natural limitations. Traders reflecting on their experiences often advocate for lifelong learning as an essential strategy for managing ever-shifting markets.
C. Final Thoughts
A comprehensive understanding of chart patterns provides you with crucial tools for effective market analysis. Traders commonly highlight that knowledge—much like money—must be used wisely to grasp the intricacies of financial markets. This knowledge empowers you, allowing you to make informed decisions even in shifting environments.
VIII. References
Nison, S. (1991). Japanese Candlestick Charting Techniques: A Contemporary Guide to the Ancient Investment Techniques of the Far East. New York: New York Institute of Finance.
Murphy, J. J. (1999). Technical Analysis of the Financial Markets: A Comprehensive Guide to Trading Methods and Applications. New York: New York Institute of Finance.
Pring, M. J. (2002). Technical Analysis Explained. New York: McGraw-Hill Education.
Chan, E. P. C. (2017). Algorithmic Trading: Winning Strategies and Their Rationale. New York: Wiley.