- ADX (Average Directional Index)(Noun)
- /A-D-X/
- Definition: A technical indicator used to quantify the strength of a trend in a market, with higher values indicating a stronger trend and lower values indicating a weaker trend.
- Etymology: "Average" from Latin "averagium," "Directional" from Latin "directionalis," and "Index" from Latin "index," meaning "pointer or indicator." This term measures the strength of a trend rather than its direction.
- Similar: Trend strength indicator
- Example: "The ADX reading above 25 suggested that the current trend was strong and likely to continue."
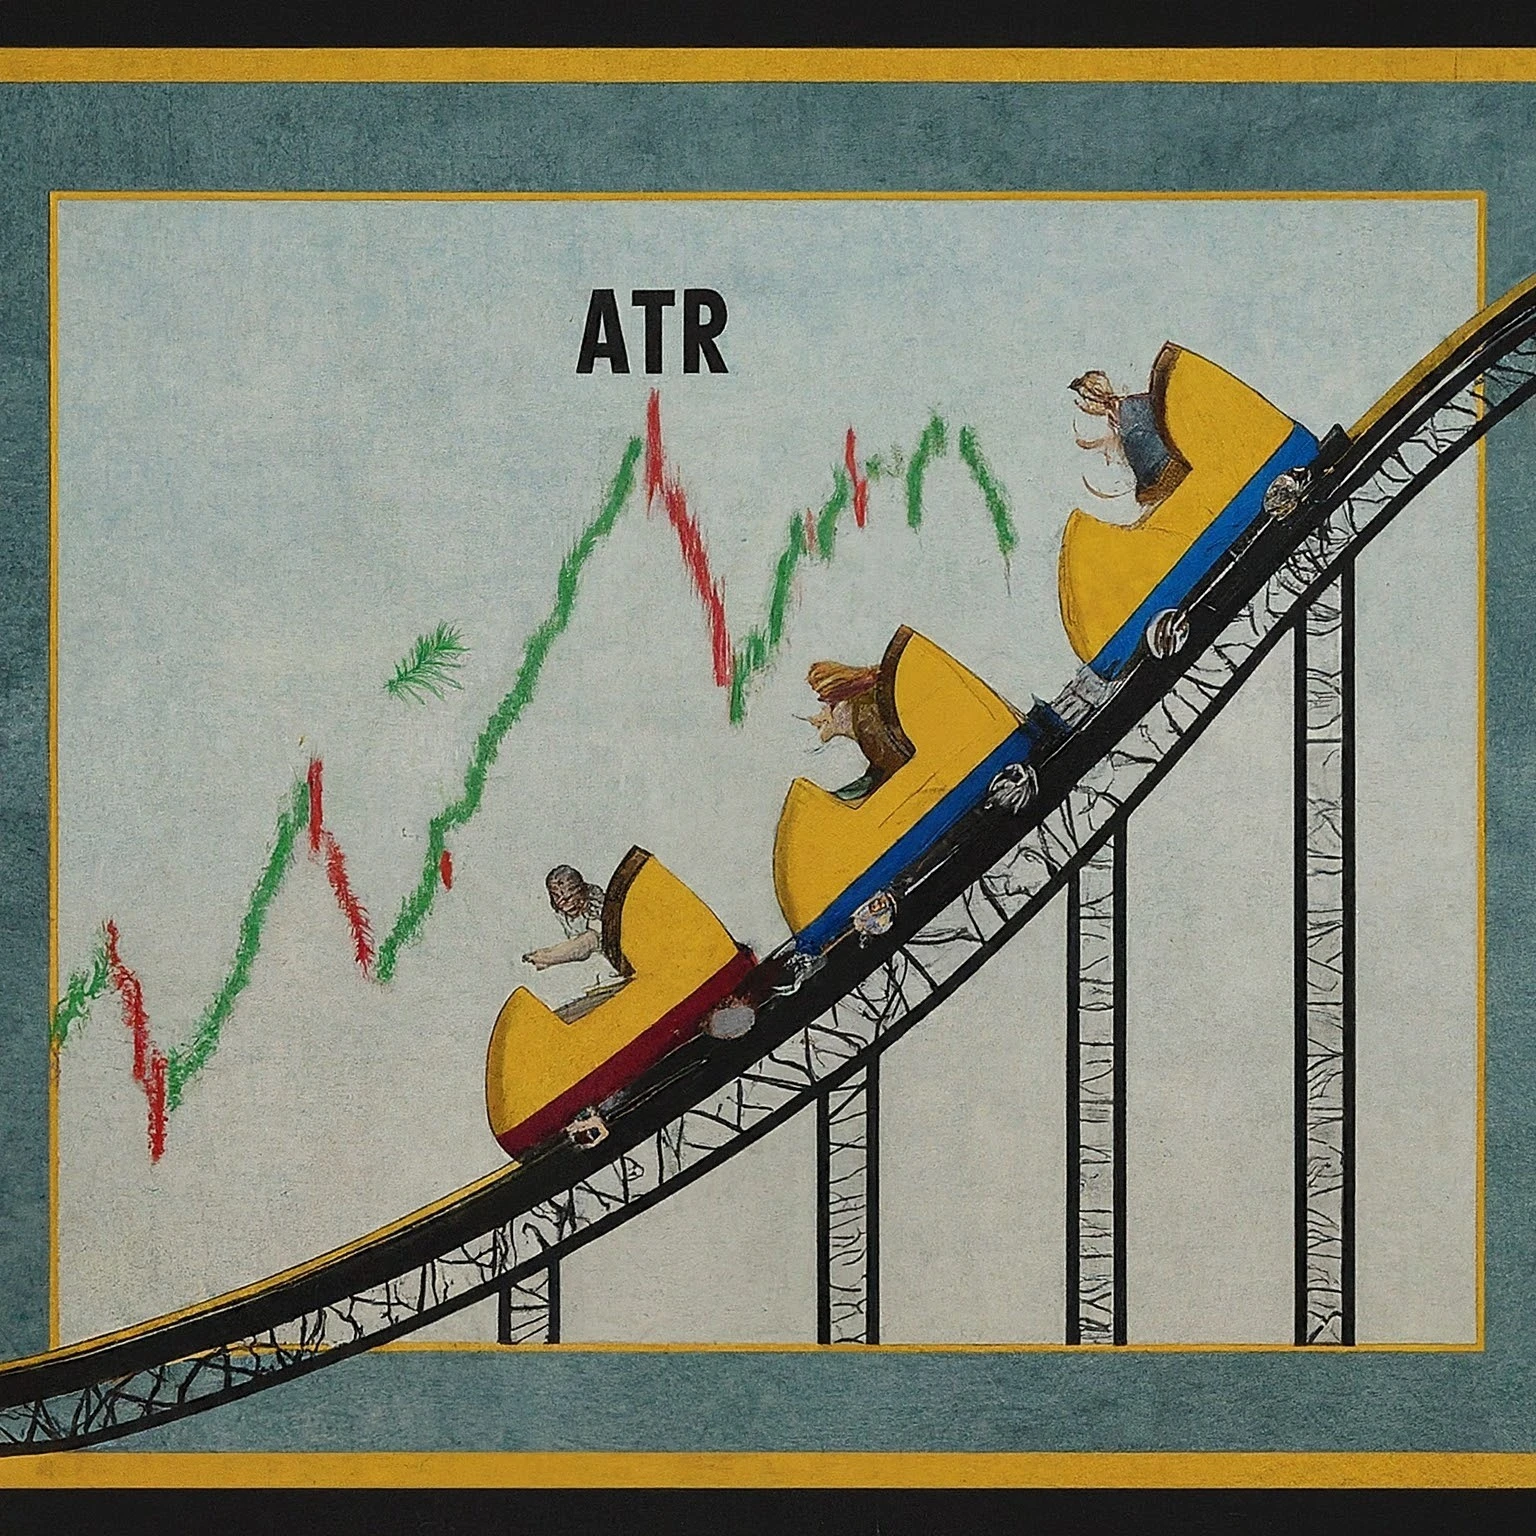
- ATR (Average True Range)(Noun)
- /A-T-R/
- Definition: A volatility indicator that measures the average range between the high and low prices of an asset over a given period, helping traders assess the level of volatility in the market.
- Etymology: "Average" from Latin "averagium," "True" from Old English "triewe," and "Range" from Old French "rang," meaning "row or line." This term provides insight into the market's volatility.
- Similar: Volatility indicator
- Example: "A rising ATR indicates increasing volatility, which may signal potential price swings."
- Candle Body(Noun)
- /KAN-dl BAH-dee/
- Definition: The rectangular area of a candlestick chart that represents the range between the opening and closing prices of a trading session, with its color indicating whether the price moved up or down.
- Etymology: "Candle" from Old English "candel," meaning "a source of light," and "Body" from Old English "bodig," meaning "trunk or torso." This term refers to the main part of a candlestick that shows the price movement within a session.
- Similar: Candlestick body
- Opposite: Candle wick
- Example: "A long candle body typically indicates strong buying or selling pressure during the session."
- Candle Wick(Noun)
- /KAN-dl wik/
- Definition: The thin lines above and below the body of a candlestick that represent the highest and lowest prices during the trading session.
- Etymology: "Candle" from Old English "candel," and "Wick" from Old English "wic," meaning "thread or string." This term indicates the range of price fluctuation within a trading session.
- Similar: Candlestick shadow
- Opposite: Candle body
- Example: "Long candle wicks can suggest price rejection at those levels, indicating potential reversals."
- Candlestick Patterns(Noun)
- /KAN-dl-stik PAT-urnz/
- Definition: Chart patterns formed by one or more candlesticks, used in technical analysis to predict future price movements based on historical patterns.
- Etymology: "Candlestick" from Old English "candelsticca," meaning "a holder for a candle," and "Patterns" from Old French "patron," meaning "model or guide." This term encompasses various formations used to forecast market trends.
- Similar: Chart patterns
- Example: "Traders often rely on candlestick patterns like the doji or engulfing patterns to identify potential market reversals."
- CCI (Commodity Channel Index)(Noun)
- /C-C-I/
- Definition: A momentum-based oscillator used in technical analysis to identify cyclical trends in a market, typically signaling overbought or oversold conditions.
- Etymology: "Commodity" from Latin "commoditas," meaning "advantage," "Channel" from Old French "chanel," meaning "canal or groove," and "Index" from Latin "index," meaning "pointer." This term helps identify deviations from average price levels.
- Similar: Momentum oscillator
- Example: "A CCI reading above 100 indicates that the asset might be overbought and due for a correction."
- Channel Trading(Noun)
- /CHAN-ul TRAY-ding/
- Definition: A trading strategy that involves buying at the lower trend line and selling at the upper trend line of a price channel, based on the assumption that the price will continue to move within the channel.
- Etymology: "Channel" from Old French "chanel," meaning "a canal or groove," and "Trading" from Old English "trædan," meaning "to tread or step." This term describes a strategy that capitalizes on price movement within a defined range.
- Similar: Range trading
- Opposite: Breakout trading
- Example: "Channel trading can be profitable in a stable market where the price consistently bounces between support and resistance levels."
- Chart Timeframe(Noun)
- /CHART TIME-fraym/
- Definition: The period over which price data is aggregated and displayed on a chart, ranging from minutes (intraday) to years (long-term), affecting how trends and patterns are interpreted.
- Etymology: "Chart" from Latin "charta," meaning "paper or map," and "Timeframe" from Old English "tima," meaning "time," and "fram," meaning "forward." This term determines the level of detail and context in price analysis.
- Similar: Chart period
- Example: "Choosing the right chart timeframe is crucial for aligning your analysis with your trading strategy."
- Convergence(Noun)
- /kuhn-VUR-jens/
- Definition: The coming together of two or more indicators, signals, or trend lines at a specific price point, often signaling a strong support or resistance level.
- Etymology: "Convergence" from Latin "convergere," meaning "to incline together." This term describes a situation where multiple technical factors align, reinforcing the significance of a price level.
- Similar: Confluence
- Opposite: Divergence
- Example: "The convergence of the moving average and trend line provided a strong buy signal."
- Divergence(Noun)
- /dy-VUR-jens/
- Definition: A situation in technical analysis where the price of an asset and an indicator move in opposite directions, often signaling a potential reversal or weakening of the current trend.
- Etymology: "Divergence" from Latin "divergere," meaning "to go in different directions." This term is used to identify discrepancies between price action and indicators, which can signal a change in trend direction.
- Similar: Discrepancy
- Opposite: Convergence
- Example: "The divergence between the RSI and the stock price suggested that the current uptrend might be losing momentum."
- DMI (Directional Movement Index)(Noun)
- /D-M-I/
- Definition: A technical indicator that identifies the direction of the market by comparing the highs and lows of consecutive trading sessions, helping traders determine the strength of a trend.
- Etymology: "Directional" from Latin "directionalis," meaning "related to direction," "Movement" from Latin "movere," meaning "to move," and "Index" from Latin "index," meaning "pointer." This term assesses the directional strength of a trend.
- Similar: Directional index
- Example: "A strong positive DMI reading indicates a strong uptrend, while a strong negative DMI reading suggests a downtrend."
- Dow Theory(Noun)
- /dow THEE-uh-ree/
- Definition: A theory of market analysis based on the writings of Charles Dow, which states that market trends have three phases and that the stock market reflects all available information, thus helping predict future movements.
- Etymology: "Dow" from the name Charles Dow, co-founder of Dow Jones & Company, and "Theory" from Greek "theoria," meaning "a looking at." This term refers to a foundational concept in technical analysis.
- Similar: Market theory
- Example: "According to Dow Theory, the market is in the accumulation phase before the next major uptrend."
- Elliott Wave Theory(Noun)
- /EL-ee-ut weyv THEE-uh-ree/
- Definition: A form of technical analysis that uses recurring fractal wave patterns to predict future market movements, based on the belief that market prices move in predictable waves influenced by investor psychology.
- Etymology: "Elliott" from the name Ralph Nelson Elliott, who developed the theory, "Wave" from Old English "wafian," meaning "to wave," and "Theory" from Greek "theoria," meaning "a looking at." This term refers to a method of predicting market trends based on wave patterns.
- Similar: Wave analysis
- Example: "Elliott Wave Theory suggests that the market is currently in the corrective phase of a larger bullish wave."
- Engulfing Pattern(Noun)
- /in-GUHL-fing PAT-urn/
- Definition: A candlestick pattern where a larger candle completely engulfs the previous smaller candle, signaling a potential reversal in the market, with a bullish engulfing indicating a reversal to the upside and a bearish engulfing indicating a reversal to the downside.
- Etymology: "Engulfing" from Old French "engolfer," meaning "to swallow up," and "Pattern" from Old French "patron," meaning "model or guide." This term describes a reversal pattern where one candlestick engulfs the previous one.
- Similar: Reversal pattern
- Opposite: Continuation pattern
- Example: "The bullish engulfing pattern on the daily chart indicated a potential reversal after a prolonged downtrend."
- Exponential Moving Average (EMA)(Noun)
- /eks-puh-NEN-shul MOO-ving AV-ur-ij/
- Definition: A type of moving average that gives more weight to recent prices, making it more responsive to new information and used to identify trends and reversals more quickly than a simple moving average.
- Etymology: "Exponential" from Latin "exponere," meaning "to set forth," "Moving" from Old English "mufan," meaning "to change position," and "Average" from Old French "avarage," meaning "financial loss." This term describes a moving average that reacts more quickly to recent price changes.
- Similar: Weighted moving average
- Opposite: Simple moving average
- Example: "Traders often use the EMA to identify potential trend reversals more quickly than the SMA."
- Fibonacci Extension(Noun)
- /fee-boh-NACH-ee ik-STEN-shun/
- Definition: A tool used in technical analysis to predict potential support and resistance levels by extending Fibonacci ratios (such as 61.8%, 100%, and 161.8%) beyond the usual range of price movements.
- Etymology: "Fibonacci" from Leonardo Fibonacci, an Italian mathematician who introduced the Fibonacci sequence to Western mathematics, and "Extension" from Latin "extensio," meaning "a stretching out." This term refers to a method for projecting price levels based on Fibonacci ratios.
- Similar: Fibonacci projection
- Opposite: Fibonacci retracement
- Example: "The Fibonacci extension levels indicated potential resistance at the 161.8% level."
- Fibonacci Fan(Noun)
- /fee-boh-NACH-ee fan/
- Definition: A charting technique that uses Fibonacci retracement levels as the base to draw lines at various angles, helping to identify potential support and resistance levels during trending markets.
- Etymology: "Fibonacci" from Leonardo Fibonacci, and "Fan" from Old English "fann," meaning "a winnowing fan." This term describes a series of trend lines drawn from a common base to identify support and resistance levels.
- Similar: Fibonacci arcs
- Example: "The Fibonacci fan provided potential support levels during the stock's pullback."
- Harmonic Patterns(Noun)
- /har-MON-ik PAT-urnz/
- Definition: A type of chart pattern that uses Fibonacci sequences to identify potential reversal points, based on the idea that price patterns repeat themselves and can be used to predict future movements.
- Etymology: "Harmonic" from Greek "harmonikos," meaning "skilled in music," and "Patterns" from Old French "patron," meaning "model or guide." This term refers to specific chart patterns that align with Fibonacci ratios.
- Similar: Fibonacci patterns
- Example: "Harmonic patterns like the Gartley and Bat patterns are popular among traders looking for precise entry and exit points."
- Heikin-Ashi(Noun)
- /HAY-kin AH-shee/
- Definition: A type of candlestick chart that filters out market noise by averaging price data, providing a smoother representation of trends and making it easier to identify the direction of the market.
- Etymology: "Heikin-Ashi" from Japanese, meaning "average bar." This term refers to a charting method that modifies traditional candlestick charts to present a clearer view of market trends.
- Similar: Average bar chart
- Opposite: Traditional candlestick chart
- Example: "Heikin-Ashi charts are useful for identifying trends without the noise seen in traditional candlestick charts."
- Ichimoku Cloud(Noun)
- /EE-chee-moh-koo klowd/
- Definition: A comprehensive technical analysis tool that consists of five different lines and a "cloud" to provide information about support, resistance, trend direction, and momentum in one glance.
- Etymology: "Ichimoku" from Japanese, meaning "one glance," and "Cloud" from Old English "clud," meaning "mass of rock." This term refers to a complex charting system that provides a holistic view of the market.
- Similar: Ichimoku Kinko Hyo
- Example: "The Ichimoku Cloud indicated strong support at the lower boundary of the cloud, suggesting a potential buying opportunity."
- Intraday Trading(Noun)
- /IN-truh-day TRAY-ding/
- Definition: A trading strategy that involves buying and selling financial instruments within the same trading day, with the goal of profiting from short-term price movements.
- Etymology: "Intraday" from Latin "intra," meaning "within," and "day" from Old English "dæg," meaning "day," and "Trading" from Old English "trædan," meaning "to tread or step." This term refers to trading activities that begin and end within the same trading session.
- Similar: Day trading
- Opposite: Swing trading
- Example: "Intraday trading requires quick decision-making to capitalize on short-term price fluctuations."
- Keltner Channels(Noun)
- /KELT-ner CHAN-ulz/
- Definition: A technical analysis indicator that consists of three lines: a central moving average and two bands above and below it, which are set at a fixed percentage or number of average true ranges away from the moving average.
- Etymology: Named after Chester Keltner, who developed the indicator, and "Channels" from Old French "chanel," meaning "a canal or groove." This term refers to a volatility-based envelope indicator used to assess trend direction and potential reversal points.
- Similar: Volatility channels
- Opposite: Bollinger Bands
- Example: "Keltner Channels are useful for identifying potential breakout points when the price moves beyond the upper or lower bands."
- Long-Term Trend(Noun)
- /lawng turm trend/
- Definition: A sustained movement in the price of an asset or market over a long period, typically several months to years, reflecting the underlying direction of the market.
- Etymology: "Long" from Old English "lang," "Term" from Latin "terminus," meaning "end or boundary," and "Trend" from Old English "trendan," meaning "to revolve or turn." This term refers to the overall direction of a market over an extended period.
- Similar: Major trend
- Opposite: Short-term trend
- Example: "Investors often focus on the long-term trend to make decisions about holding or selling assets."
- MACD Histogram(Noun)
- /M-A-C-D HIS-toh-gram/
- Definition: A graphical representation of the difference between the MACD line and the signal line, used to identify changes in momentum and potential buy or sell signals.
- Etymology: "MACD" stands for Moving Average Convergence Divergence, and "Histogram" from Greek "histos," meaning "something set upright," and "gramma," meaning "something written." This term visualizes the relationship between moving averages to assess momentum.
- Similar: MACD bars
- Example: "A rising MACD histogram indicates increasing bullish momentum, while a falling histogram suggests bearish momentum."
- Momentum Indicators(Noun)
- /moh-MEN-tuhm in-duh-KAY-turz/
- Definition: A class of technical indicators used to measure the speed or strength of a price movement, helping traders identify potential overbought or oversold conditions and possible reversals.
- Etymology: "Momentum" from Latin "movere," meaning "to move," and "Indicators" from Latin "indicatum," meaning "something pointed out." This term refers to tools that assess the pace of price changes.
- Similar: Oscillators
- Opposite: Trend indicators
- Example: "Momentum indicators like RSI and Stochastic Oscillator help traders gauge the strength of a trend and potential reversal points."
- Moving Average Ribbon(Noun)
- /MOO-ving AV-ur-ij RIB-un/
- Definition: A series of moving averages plotted on the same chart, with different time periods, used to visualize the direction of a trend and potential areas of support and resistance.
- Etymology: "Moving" from Old English "mufan," "Average" from Old French "avarage," and "Ribbon" from Middle English "ribban," meaning "a narrow strip." This term describes multiple moving averages that create a ribbon-like visual on a chart.
- Similar: Multiple moving averages
- Opposite: Single moving average
- Example: "The moving average ribbon indicated a strong bullish trend as all the moving averages were aligned upward."
- Parabolic SAR(Noun)
- /par-uh-BOL-ik S-A-R/
- Definition: A trend-following indicator that sets trailing stop levels above or below the price, helping traders identify potential reversals and set stop-loss orders.
- Etymology: "Parabolic" from Greek "parabole," meaning "comparison," and "SAR" stands for "Stop and Reverse." This term refers to a method for setting stop levels based on the current trend.
- Similar: Stop and reverse indicator
- Example: "The parabolic SAR indicated a potential trend reversal as the dots switched from below to above the price."
- Pivot Points(Noun)
- /PIV-ut poynts/
- Definition: A technical analysis tool used to determine potential support and resistance levels, calculated using the high, low, and closing prices of a previous period, often used by day traders.
- Etymology: "Pivot" from Old French "pivot," meaning "shaft or pin," and "Points" from Old French "point," meaning "dot or mark." This term refers to key price levels that can indicate potential turning points in the market.
- Similar: Support and resistance levels
- Example: "Traders often use pivot points to identify potential entry and exit points during intraday trading."
- Point and Figure Chart(Noun)
- /poynt and FIG-yur chahrt/
- Definition: A type of chart that plots price movements without taking time into consideration, using X's and O's to represent rising and falling prices, respectively, and focusing solely on significant price changes.
- Etymology: "Point" from Old French "point," meaning "dot or mark," "Figure" from Latin "figura," meaning "shape," and "Chart" from Latin "charta," meaning "paper or map." This term refers to a charting method that simplifies price action by filtering out minor movements.
- Similar: P&F chart
- Opposite: Line chart
- Example: "The point and figure chart highlighted key support and resistance levels by focusing on significant price moves."
- Position Trading(Noun)
- /: puh-ZISH-un TRAY-ding/
- Definition: A trading strategy where positions are held for weeks, months, or even years, with the goal of profiting from long-term trends rather than short-term price fluctuations.
- Etymology: "Position" from Latin "positio," meaning "a placing," and "Trading" from Old English "trædan," meaning "to tread or step." This term describes a strategy that focuses on capturing significant price movements over an extended period.
- Similar: Long-term trading
- Opposite: Day trading
- Example: "Position trading allows investors to hold onto a stock to capitalize on long-term trends without worrying about short-term volatility."
- Price Channels(Noun)
- /prahys CHAN-ulz/
- Definition: A technical analysis tool that consists of two parallel lines that form a channel around the price action, helping traders identify potential buy and sell signals based on the channel's boundaries.
- Etymology: "Price" from Old French "pris," meaning "value," and "Channels" from Old French "chanel," meaning "a canal or groove." This term refers to the boundaries within which the price of an asset moves over time.
- Similar: Trading channels
- Opposite: Price breakout
- Example: "Price channels can help traders identify overbought or oversold conditions when the price touches the channel's boundaries."
- Price Oscillator(Noun)
- /prahys OSS-uh-lay-tor/
- Definition: A momentum indicator that shows the difference between two moving averages, helping traders identify the strength and direction of a trend.
- Etymology: "Price" from Old French "pris," meaning "value," and "Oscillator" from Latin "oscillare," meaning "to swing." This term measures the degree of movement between different moving averages.
- Similar: MACD
- Example: "The price oscillator indicated bullish momentum as the shorter moving average crossed above the longer moving average."
- Price Projection(Noun)
- /prahys pruh-JEK-shun/
- Definition: An estimate of future price levels based on past price movements, technical indicators, and chart patterns, often used to set target prices for trades.
- Etymology: "Price" from Old French "pris," meaning "value," and "Projection" from Latin "proicere," meaning "to throw forward." This term refers to the anticipated future price levels derived from technical analysis.
- Similar: Price forecast
- Opposite: Price history
- Example: "The price projection suggested that the stock could reach $150 based on the measured move from its recent breakout."
- Rate of Change (ROC)(Noun)
- /reyt of chaynj (R-O-C)/
- Definition: A momentum oscillator that measures the percentage change in price between the current price and a previous price, used to identify the speed and strength of a trend.
- Etymology: "Rate" from Old French "rat," meaning "reckoning," "of" from Old English "of," meaning "away from," and "Change" from Old English "cien," meaning "to become different." This term quantifies the velocity of price movements over a specific period.
- Similar: Momentum indicator
- Opposite: Static price
- Example: "A high Rate of Change indicates strong momentum, while a low ROC suggests weakening momentum."
- Renko Chart(Noun)
- /REN-koh chahrt/
- Definition: A type of chart that filters out minor price movements by only recording price changes that meet a certain threshold, creating a series of bricks that move up or down depending on price direction.
- Etymology: "Renko" from Japanese "renga," meaning "brick," and "Chart" from Latin "charta," meaning "paper or map." This term describes a charting method that emphasizes significant price movements while ignoring smaller fluctuations.
- Similar: Brick chart
- Opposite: Candlestick chart
- Example: "Renko charts are useful for identifying clear trends by filtering out noise from minor price movements."
- RSI Divergence(Noun)
- /R-S-I dy-VUR-jens/
- Definition: A situation where the Relative Strength Index (RSI) moves in the opposite direction of the price, often signaling a potential reversal in the market trend.
- Etymology: "RSI" stands for Relative Strength Index, "Divergence" from Latin "divergere," meaning "to go in different directions." This term refers to a discrepancy between the RSI and price movements that may indicate a trend change.
- Similar: Indicator divergence
- Opposite: RSI convergence
- Example: "The RSI divergence suggested that the current uptrend might be losing strength, with a potential reversal on the horizon."
- Short-Term Trend(Noun)
- /short turm trend/
- Definition: A trend in the price of an asset or market that lasts for a short period, typically days to weeks, reflecting immediate market sentiment.
- Etymology: "Short" from Old English "sceort," "Term" from Latin "terminus," meaning "end or boundary," and "Trend" from Old English "trendan," meaning "to revolve or turn." This term refers to the direction of price movement over a brief period.
- Similar: Minor trend
- Opposite: Long-term trend
- Example: "The short-term trend is bullish, but traders should be cautious as the long-term trend remains bearish."
- Simple Moving Average (SMA)(Noun)
- /SIM-pul MOO-ving AV-ur-ij/
- Definition: A technical indicator that calculates the average of a security's price over a specified number of periods, smoothing out price data to identify trends.
- Etymology: "Simple" from Latin "simplus," meaning "single," "Moving" from Old English "mufan," and "Average" from Old French "avarage." This term refers to a basic moving average that assigns equal weight to all data points.
- Similar: Arithmetic moving average
- Opposite: Exponential moving average
- Example: "The simple moving average provides a clear view of the underlying trend by smoothing out daily price fluctuations."
- Stochastic Oscillator(Noun)
- /stoh-KAS-tik OSS-uh-lay-tor/
- Definition: A momentum indicator that compares a security's closing price to its price range over a specific period, used to identify overbought or oversold conditions.
- Etymology: "Stochastic" from Greek "stochastikos," meaning "capable of guessing," and "Oscillator" from Latin "oscillare," meaning "to swing." This term measures the momentum of price movements within a specific range.
- Similar: Momentum oscillator
- Opposite: Trend indicator
- Example: "The stochastic oscillator indicated that the stock was overbought, signaling a potential pullback."
- Swing High(Noun)
- /swing HAHY/
- Definition: The peak point reached by a price before it reverses downward, often used to identify resistance levels and potential areas for selling.
- Etymology: "Swing" from Old English "swingan," meaning "to move back and forth," and "High" from Old English "heah," meaning "of great height." This term refers to the highest point in a price movement before a reversal.
- Similar: Price peak
- Opposite: Swing low
- Example: "Traders often set stop-loss orders just above the previous swing high to protect against potential losses."
- Swing Low(Noun)
- /swing loh/
- Definition: The lowest point reached by a price before it reverses upward, often used to identify support levels and potential areas for buying.
- Etymology: "Swing" from Old English "swingan," meaning "to move back and forth," and "Low" from Old Norse "lagr," meaning "not high." This term refers to the lowest point in a price movement before a reversal.
- Similar: Price trough
- Opposite: Swing high
- Example: "Identifying swing lows helps traders determine potential entry points for long positions."
- Take-Profit Order(Noun)
- /tayk PRO-fit awr-der/
- Definition: An order placed with a broker to automatically close a position once it reaches a certain profit level, securing gains without the need for manual intervention.
- Etymology: "Take" from Old English "tacan," meaning "to grasp," "Profit" from Latin "proficere," meaning "to make progress," and "Order" from Old French "ordre," meaning "arrangement." This term refers to an instruction to lock in profits once a target price is reached.
- Similar: Profit target
- Opposite: Stop-loss order
- Example: "Setting a take-profit order at key resistance levels can help ensure that gains are captured during volatile market conditions."
- Trend Lines(Noun)
- /: trend lahynz/
- Definition: Straight lines drawn on a chart to connect two or more price points, indicating the direction of the trend and helping traders identify potential areas of support and resistance.
- Etymology: "Trend" from Old English "trendan," meaning "to revolve or turn," and "Lines" from Latin "linea," meaning "string or thread." This term describes lines used to identify the direction and strength of a trend.
- Similar: Support/resistance lines
- Example: "Trend lines are essential tools for identifying the direction of the market and potential reversal points."
- Trend Strength(Noun)
- /trend strength/
- Definition: A measure of the intensity or robustness of a market trend, indicating whether the current trend is likely to continue or reverse.
- Etymology: "Trend" from Old English "trendan," meaning "to revolve or turn," and "Strength" from Old English "strengðu," meaning "power or force." This term assesses how strong a market trend is, helping traders gauge its sustainability.
- Similar: Trend robustness
- Opposite: Trend weakness
- Example: "Indicators like the ADX are used to measure trend strength and determine whether a trend is gaining or losing momentum."
- Volatility Measurement(Noun)
- /vol-uh-TIL-i-tee MEZH-ur-muhnt/
- Definition: The process of quantifying the degree of variation in a financial instrument's price over time, often using indicators like ATR or Bollinger Bands to assess market risk and potential price swings.
- Etymology: "Volatility" from Latin "volatilis," meaning "fleeting," and "Measurement" from Latin "mensurare," meaning "to measure." This term refers to the analysis of price fluctuations to gauge market uncertainty.
- Similar: Volatility analysis
- Opposite: Stability measurement
- Example: "Volatility measurement is crucial for setting appropriate stop-loss levels and managing risk in trading."
- Volume Profile(Noun)
- /VOL-yoom PRO-fahyl/
- Definition: A technical analysis tool that plots the volume of trades executed at each price level over a specific period, helping traders identify areas of high buying or selling interest, often used to assess support and resistance levels.
- Etymology: "Volume" from Latin "volumen," meaning "a roll or scroll," and "Profile" from Italian "profilare," meaning "to draw in outline." This term describes a visual representation of trading activity at different price levels.
- Similar: Volume analysis
- Opposite: Price-only analysis
- Example: "The volume profile indicated a strong area of support at $50, where a significant amount of buying had occurred."