Introduction
As a value-seeking investor, you recognize that smart investing relies on knowledgeable choices and detailed analysis. Among the many metrics available, the Price-to-Earnings (P/E) ratio is crucial for fundamental analysis. To put it another way: when deciding whether to treat yourself to a gourmet pizza, you consider both the flavor and the price. In the same manner, the P/E ratio helps you evaluate how much you are ready to invest for every dollar of a company's earnings. Knowing if a stock is overpriced or underpriced is vital for shaping your investment strategy; it enables you to find valuable opportunities in the market.
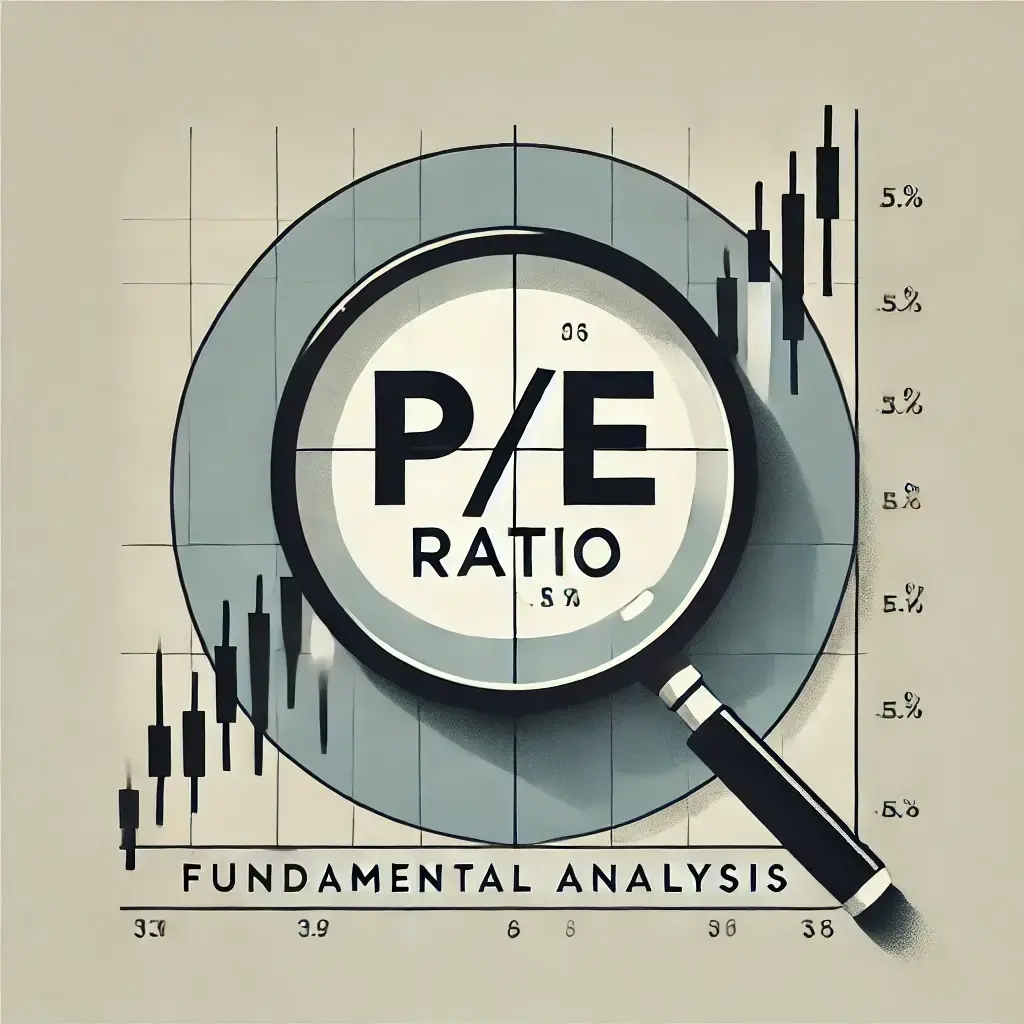
This article will explore the importance of the P/E ratio by looking at its strengths, weaknesses, and comparisons with other key valuation metrics, reflecting the approach of experienced investors who view valuation metrics as ingredients that must work together for the end dish. If you seek a more detailed look at analyzing company financial statements, check out How to Analyze a Company’s Financial Statements for Investment Decisions. By understanding the details around the P/E ratio, you will improve your awareness of the investment landscape.
Understanding the P/E Ratio
What is the P/E Ratio?
The P/E ratio is calculated using a simple formula:
[ \text{P/E Ratio} = \frac{\text{Market Price per Share}}{\text{Earnings per Share (EPS)}} ]
This metric shows how much you, as an investor, are willing to pay for each dollar of a company's earnings. Generally, a high P/E ratio indicates that investors expect significant future growth, while a low P/E may suggest undervaluation or potential issues with the company's future that need more investigation. A high P/E ratio suggests that investors foresee considerable future growth; "High P/E ratios are often linked to investors' positive outlook on future growth, while low P/E ratios may indicate undervaluation or underlying concerns about future performance" (Fama & French, 1992). Therefore, the P/E ratio acts as a guide for investors assessing market ups and downs, helping them evaluate the value of their investments. Buffett (2013) emphasizes the importance of this metric by indicating that "Investors can rely on fundamental measures like the P/E ratio as a reference for understanding the unavoidable fluctuations of the market,” underscoring its role in informed investment decisions.
Understanding Earnings Per Share (EPS) is key for calculating the P/E ratio. You may find valuable information in our article, Understanding Earnings Per Share (EPS) in Stock Valuation.
Types of P/E Ratios
To enhance your analytical toolkit, it is important to recognize the different types of P/E ratios:
-
Trailing P/E: This ratio is determined using earnings from the past twelve months, offering insights into how a company has performed recently and its operational efficiency.
-
Forward P/E: This ratio looks at expected future earnings, highlighting potential areas for growth. While it can provide useful indications about expected growth, it's crucial to consider these forecasts carefully; predicting future earnings can be uncertain. "Understanding the difference between trailing and forward P/E ratios is important for investors, as the former is based on past earnings while the latter anticipates future earnings, yielding a fuller view of valuation" (Bodie, Kane, & Marcus, 2014).
A financial analyst at a well-known firm might sift through those P/E ratios much like a jeweler inspects the clarity and cut of a diamond. Both trailing and forward P/E ratios play vital roles in evaluating a company’s past performance and future growth potential. Additionally, you may want to look into How to Use the PEG Ratio in Stock Analysis for deeper insights on valuation, particularly for growth stocks.
The P/E Ratio in Context
Analyzing Historical Trends
Over time, the role of the P/E ratio has changed significantly. What started as a basic measure of stock stability now plays a more complex role—especially in industries like technology, where growth expectations can be exceptionally high. Analyzing P/E ratios is like a historian reviewing a country’s history to predict its future. Furthermore, considering external factors and their influence on stock value assessments is essential; for instance, understanding The Impact of Economic Indicators Affecting the Stock Market can greatly improve your ability to contextualize P/E ratios relative to historical trends.
Practical Implications
To effectively analyze P/E ratios, consider historical averages. For example, the S&P 500 usually has a P/E ratio between 15 and 20. When stocks significantly differ from this benchmark, they can provide important insights: a notably high P/E ratio might suggest overvaluation, while a particularly low P/E could reveal appealing investment opportunities. In this context, a high P/E ratio might be seen as a warning sign amidst a sea of green, prompting investors to question the stock's reliability.
Acknowledging Limitations
While the P/E ratio is a strong tool, acknowledging its limitations is important. For instance, picture a situation where analysts misjudge a stock’s value based only on the P/E ratio, much like how a doctor might misdiagnose a condition without thorough evaluation. Factors such as earnings manipulation, differences across industries, and changing market conditions can affect the relevance of the ratio. "Investors must recognize the inherent limitations of the P/E ratio, including its exposure to earnings manipulation and variations that can hinder meaningful comparisons across industries" (Poon & Rantakari, 2017). A tech firm with a high P/E ratio may support its position based on impressive growth prospects, while a low P/E in a struggling manufacturing company might uncover broader operational problems. This is why grasping ideas like Understanding Market Capitalization: What It Means for Investors is crucial for putting a stock's value into context.
Integrating the P/E Ratio with Other Metrics
To build a complete picture of a stock's value, it's helpful to combine the P/E ratio with other financial metrics:
-
Price-to-Book (P/B) Ratio: This metric assesses a company's market value in relation to its book value. A high P/B ratio along with a high P/E ratio may indicate overvaluation.
-
Price-to-Sales (P/S) Ratio: This metric is especially useful for companies not producing positive earnings yet showing strong sales growth, providing another angle for evaluation.
-
PEG Ratio: The Price/Earnings to Growth (PEG) ratio connects growth potential to valuation, offering deeper insights into how a stock’s value aligns with its expected growth rate.
Picture a diversified fund manager creatively weaving together metrics like P/E and P/B as strands in a safety net, which helps them identify possible investment opportunities.
Practical Applications for Investors
Using the P/E ratio can greatly improve your investment strategy. Here are specific methods for value-seeking investors:
-
Stock Screening: Consider stock screening as a sharp-eyed hawk scanning the terrain for unsuspecting prey, representing the investor's careful search for undervalued stocks. Use the P/E ratio as a strong screening tool to find potentially undervalued stocks for your portfolio. By setting certain P/E standards, you can reveal hidden investment opportunities that may otherwise be overlooked. Additionally, addressing common pitfalls can improve your approach; see Top Mistakes Beginners Make in the Stock Market for advice on this topic.
-
Comparative Analysis: Explain how experienced financiers often spend considerable time examining P/E ratios among competitors, similar to a sommelier tasting wines to select the best pairings for a meal. Compare P/E ratios among peer companies in your industry. This comparative method can uncover relative values and opportunities that might be overlooked.
-
Adapting Strategies: Being familiar with the P/E ratio allows you to modify your strategies according to changing market conditions. This flexibility can enhance your portfolio's strength against market fluctuations. For more advanced strategies in understanding the market, consider How to Choose Stocks for Long-Term Investment.
Conclusion
Mastering the P/E ratio provides investors with a reliable boat, allowing them to steer through the choppy waters of finance, ensuring they stay focused on their investment goals. In the complex world of investing, the P/E ratio stands out as a key tool for achieving long-term success. When used thoughtfully and with contextual understanding, it offers valuable insights into stock valuations. However, recognizing its limitations and pairing it with other important financial metrics is essential for maintaining a well-rounded investment perspective.
As you explore the subtleties of the P/E ratio alongside various financial indicators, you not only boost your ability to make informed choices but also deepen your grasp of investment dynamics in a diverse market environment. Your dedication to ongoing education in financial analysis not only strengthens your portfolio but also prepares you to gain knowledge that informs your strategic investment decisions.
Ethical Considerations
As you hone your analysis of financial metrics, note how a top-tier investment firm prioritizes transparency to protect its integrity, much like how a trustworthy journalist verifies facts before publication. Ethically representing P/E calculations helps prevent errors and encourages responsible investment practices. Strict adherence to ethical standards is crucial for safeguarding one’s reputation and building trust with clients. For further exploration, the insights in The Role of Corporate Governance in Fundamental Analysis may be quite enlightening.
Further Exploration
Push yourself to investigate the P/E ratio further: How do current economic trends shape its interpretation? Which additional metrics could enrich your investment strategy? Encourage examination of aspects like economic conditions as a challenging path, where each turn leads to new insights. Embracing a curious mindset will empower you to refine your approach and explore the other metrics that could further enhance your investment strategy as you confidently maneuver through the constantly evolving financial landscape. To dive deeper into this subject, consider the article on How Economic Indicators Affect the Stock Market.
References
- Bodie, Z., Kane, A., & Marcus, A. J. (2014). Investments. McGraw-Hill Education.
- Buffett, W. E. (2013). Berkshire Hathaway Letter to Shareholders.
- Fama, E. F., & French, K. R. (1992). The Cross-Section of Expected Stock Returns. Journal of Finance, 47(2), 427-465.
- Graham, B., & Dodd, D. L. (2008). Security Analysis. McGraw-Hill.
- Poon, W. P. H., & Rantakari, H. (2017). Misleading earnings in cross-section of stock returns: Evidence from the P/E ratio. Journal of Accounting and Economics, 63(1), 56-73.