I. Introduction
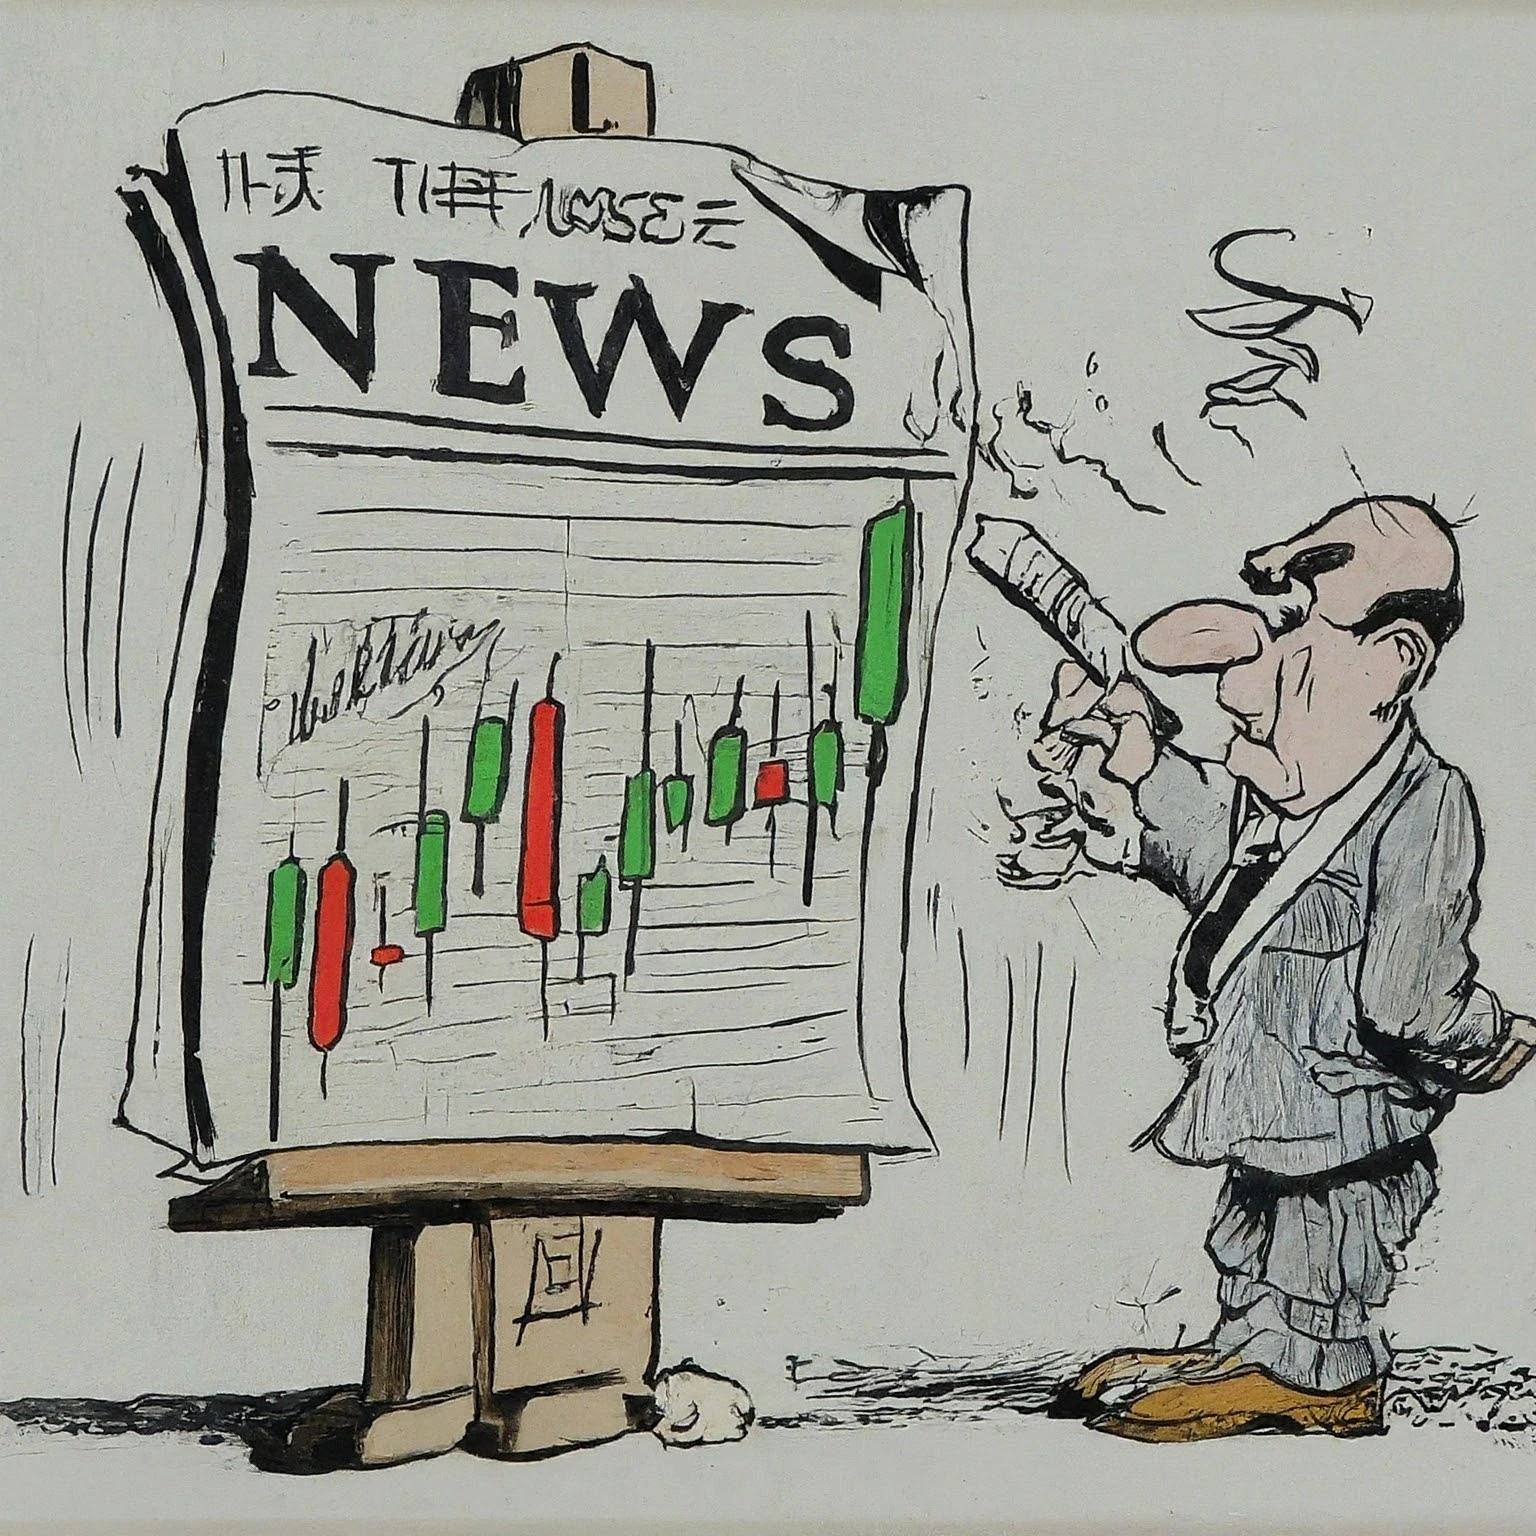
In the fast-moving world of finance, market news can have a significant impact on asset prices, often causing quick and notable changes. Just as sailors use maps to guide their journey through stormy seas, traders depend on chart patterns to steer through unpredictable market movements. For finance professionals—financial analysts, stock traders, investment managers, and independent investors—grasping the details of chart patterns is not just beneficial; it is crucial for implementing effective trading strategies. These patterns are not only visual depictions of price trends but also serve as essential tools that aid in making entry and exit decisions with great accuracy. According to Pring (2002), chart patterns are essential signals for traders, indicating specific entry and exit points to optimize profit potential (p. 154). A solid grasp of these patterns can greatly improve trading skills.
For those new to trading, the insights in the article "How to Read Stock Charts: A Beginner’s Guide" may provide valuable foundational knowledge that complements an understanding of technical analysis.
The active relationship between market news and chart patterns is central to this discussion. A striking example involves a portfolio manager who adjusted investment strategies after rapid changes in economic indicators, highlighting the importance of contextual understanding. Market news can heavily influence asset prices. Baker and Wurgler (2006) argue that market news plays a significant role in driving asset prices, resulting in fluctuations that investors must interpret using technical analysis (p. 1655). Important economic indicators, quarterly earnings reports, and geopolitical events often drive price changes that correspond to recognizable shapes on the charts. This paper will explore this multifaceted relationship, supported by historical examples and psychological insights. Ultimately, the aim is to equip readers with practical strategies that enhance decision-making in a volatile market.
II. Thesis Statement
This research aims to clarify the complex interaction between market news and chart patterns. By synthesizing historical case studies and engaging in multifactorial analyses from behavioral finance, this work intends to offer concrete strategies for optimizing market news usage in investment decisions. Understanding how economic indicators influence the stock market is vital, as detailed in the article "How Economic Indicators Affect the Stock Market".
III. Literature Review
A. Theoretical Framework
1. Overview of Technical Analysis
At the core of trading is technical analysis, a methodical approach that assesses securities based on price movements and trading volumes. This systematic approach is essential for analyzing market trends linked to established chart patterns. Key concepts include:
-
Chart Patterns: Recognizable formations such as head and shoulders, flags, and double tops enable traders to predict possible price paths based on past behavior. Mastering these patterns is crucial for confidently evaluating market forecasts. Pring (2002) notes that skill in chart patterns aids in making decisive trading moves.
-
Indicators: Tools like moving averages and the Relative Strength Index (RSI) are vital for evaluating market conditions, offering insights essential for informed strategic decisions.
-
Volatility: A thorough understanding of price changes is essential, with increased volatility usually highlighting distinct chart patterns that require quick trading strategies to take advantage of opportunities.
2. Historical Impact of Market News
Compelling historical examples show the significant effect of market news on stock prices and chart patterns. Notable examples include:
-
The 2008 financial crisis, when revelations about mortgage-backed securities led to sharp declines in asset prices, transforming chart patterns into clear signs of a bear market. Reinhart and Rogoff (2009) emphasize that major financial crises, like that of 2008, significantly change market dynamics and highlight shifts in chart patterns that traders must adjust to (p. 120). This illustrates the necessity for traders to remain responsive to changing market conditions.
-
Earnings reports often act as triggers for changes in market dynamics; studies show that positive surprises correspond with bullish patterns, while negative surprises frequently cause bearish movements. To understand how these reports affect trading behavior, you may refer to "Earnings Reports: What Investors Need to Know".
3. Relevant Studies
Research in behavioral finance, especially from thinkers like Daniel Kahneman and Eugene Fama, sheds light on how emotional and cognitive biases shape trading behaviors. Thaler (1993) notes that cognitive biases and emotional reactions are crucial for grasping how market news affects traders and their decision-making (p. 15). These insights highlight how chart movements can influence emotions, complicating the development of objective trading strategies, particularly in high-volatility environments. Technical analysis serves as a toolkit for examining price fragments to piece together a broader understanding of market movements.
B. Recent Developments
1. Technological Advancements
Recent improvements in algorithmic trading and the swift spread of market news have changed trading methods. Aldridge and Krawciw (2017) observe that while algorithmic trading provides advanced decision-making capabilities, it also risks amplifying volatility in fast market situations (p. 35). While algorithmic trading facilitates quick decisions, it can also expose traders to automated errors during rapid market drops. Modern algorithms analyze large data sets to assess sentiment and adjust trading responses in real-time, profoundly influencing chart patterns and strategies in fast-moving market conditions.
2. Case Studies
The volatility seen during the COVID-19 pandemic serves as a clear example of how rapidly changing news can disrupt established chart patterns across main stock indices. By examining these instances, readers can develop proactive strategies that anticipate uncertainties and take advantage of market fluctuations, with insights regarding volatility management available in the resource "How to Handle Stock Market Volatility: Tips for New Investors".
IV. Methodology
A. Research Design
This investigation employs an epistemological mixed-methods approach, blending qualitative insights with quantitative data to deepen the understanding of the connection between market news and chart patterns. Primary sources consist of financial news articles, historical stock market datasets, and pertinent academic literature.
B. Analytical Framework
By assessing key news events, we will examine their effects and timing on market fluctuations. Rigorous statistical methods will analyze correlations between news releases and subsequent price changes, revealing valuable trading signals. This research design acts as a bridge linking quantitative data and qualitative insights in financial studies.
V. Analysis
A. Correlation between Market News and Chart Patterns
1. Categorization of Market News Types
-
Economic Indicators: Metrics like GDP growth, unemployment rates, and inflation have substantial impacts on market sentiment, shaping corresponding chart patterns. Understanding how these indicators affect market sentiment is further discussed in "Understanding Bull and Bear Markets: What They Mean for Investors".
-
Corporate Announcements: News about earnings forecasts or management changes can drive price movements that create clear chart formations.
-
Geopolitical Context: Events such as elections or international conflicts heighten market volatility, directly affecting the formation of chart patterns.
2. Specific News Impacts on Chart Patterns
-
Positive News: Exceeding earnings expectations usually leads to bullish chart patterns, such as ascending triangles, indicating upward movement and growing buying interest.
-
Negative News: Disappointing data can lead to bearish formations, like double tops, indicating possible price declines and increased selling pressure.
B. Psychological Factors Influencing Trading Behavior
Traders often react to market news based more on emotions than on rational analysis:
-
Sentiment Analysis: Grasping the prevailing market sentiment is essential. However, emotional volatility can hinder rational decision-making, especially in high-stakes trading situations.
-
Cognitive Biases: Psychological tendencies—such as herd behavior and confirmation bias—often lead to irrational trading decisions during sensational news cycles, complicating trading strategies. Cognitive biases are the unseen barriers that traders must face; ignoring them can result in misjudgments in high-pressure situations. For further understanding of these influences, consider the insights offered in the article "How Cognitive Biases Affect Trading Decisions".
C. Risk Management and Strategic Implications
1. Refining Strategies Based on Post-News Chart Patterns
Incorporating news analysis into technical evaluations enables real-time modifications to entry and exit strategies, ensuring alignment with changing price dynamics and minimizing potential losses.
2. Risk Considerations in News-Driven Trading
Understanding the intricacies of market volatility and responding swiftly to news developments is crucial for effective risk management. Implementing contingency plans in trading strategies is vital to reduce risks during unexpected market fluctuations. Using tools like stop-loss orders and adhering to disciplined position sizing can help manage risks in unstable market conditions.
VI. Discussion
A. Critical Assessment of Chart Patterns and Market News
Even though they hold intrinsic value, chart patterns can lose their predictive power in highly volatile markets influenced by breaking news:
-
Limitations of Chart Patterns: During extreme volatility, chart formations may send unclear signals, making actionable insights more challenging to attain. Martin (2014) points out that in times of extreme volatility, chart patterns might not offer clear guidance, leading to uncertain trading signals (p. 120). Thus, in volatile markets, chart patterns can become perilous waters, challenging traders' abilities to make sound decisions amid chaos.
-
Market Rationality: The assumption that markets will respond predictably to news can be challenged by emotional trading behaviors that defy established analytical expectations. An infamous trader once remarked how deceptive signals during a volatile news phase can abruptly change their trading approach, complicating their strategies.
B. Future Research Directions
Future studies would gain from long-term analyses that uncover the combined effects of various types of news on price trends and chart behavior. Future research initiatives can act as a guiding light, revealing pathways in the fog of uncertain market actions. Incorporating machine learning for predictive analytics centered on news triggers could provide valuable insights and improve trading performance.
VII. Conclusion
A. Summary of Key Findings
The complex relationship between market news and chart patterns highlights a fundamental truth of successful trading: a nuanced awareness of the factors that drive price changes is crucial for informed decision-making and strategic investment. Numerous traders have found considerable success by carefully applying insights gained from the intricate relationship between market news and chart patterns.
B. Final Thoughts
Steering through the volatile world of trading, understanding the link between market news and chart patterns can provide readers with the tools necessary to avoid potential challenges. Being aware of the continuously evolving relationship between market news and chart patterns is critical for sustained trading success. Ongoing education is like sharpening a tool; the more skilled the individual, the more effectively they can handle the challenges of the financial landscape, supported by the understanding conveyed in "The Importance of Staying Informed in the Stock Market".
VIII. References
- Aldridge, I., & Krawciw, S. (2017). Real-Time Risk: Managing Market Risk Across Trading Systems. Wiley.
- Baker, S. R., & Wurgler, J. (2006). Investor sentiment and the cross-section of stock returns. The Journal of Finance, 61(4), 1645-1680.
- Martin, J. S. (2014). The practical applications of technical analysis in volatile markets. Journal of Derivatives & Hedge Funds, 20(2), 105-120.
- Pring, M.J. (2002). Technical Analysis Explained. McGraw-Hill Education.
- Reinhart, C. M., & Rogoff, K. S. (2009). This Time is Different: Eight Centuries of Financial Folly. Princeton University Press.
- Thaler, R. H. (1993). Advances in Behavioral Finance. Russell Sage Foundation.